
This article will take Apache APISIX Ingress Controller as an example to show you in detail how to quickly use different types of gateways and status monitoring for Kubernetes clusters through KubeSphere.
In early November, KubeSphere released version 3.2.0, which added a full set of monitoring and management pages for project gateways, and introduced cluster gateways to provide global Ingress gateway capabilities at the cluster level.
To help users better understand how to deploy and use third-party Ingress Controllers in the new version of KubeSphere, this article will use the Apache APISIX Ingress Controller as an example to show you how to quickly use different types of gateways for Kubernetes clusters with KubeSphere and perform status monitoring.
Preparation
Installing KubeSphere
There are two ways to install KubeSphere.
- Install directly on Linux
- Install on existing Kubernetes
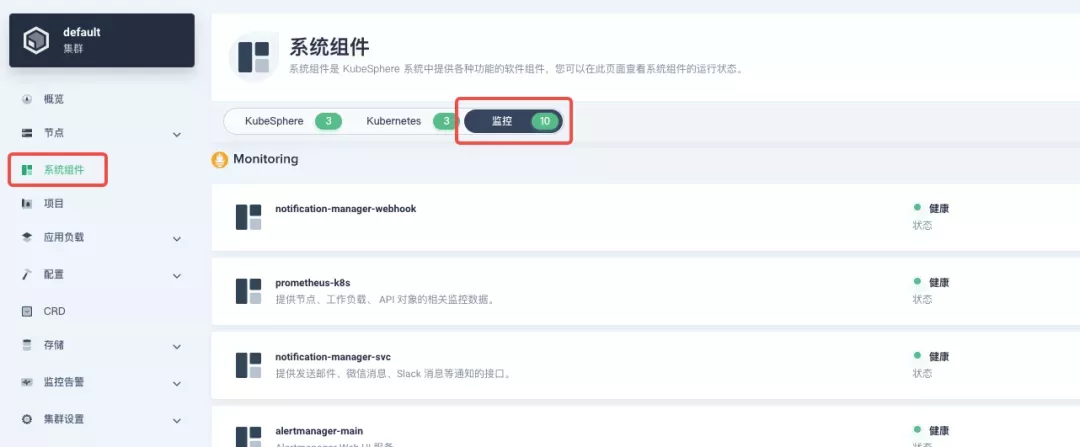
The monitoring module is already included in the minimal installation of KubeSphere, so there is no need to enable it additionally, and you can confirm the installation status via the Monitoring tab on the System Components page.
Deploying the httpbin demo application
Since we need to demonstrate the access control capabilities of the gateway, we must first have an accessible application as a backend service for the gateway. Here we use the kennethreitz/httpbin container application provided by httpbin.org as our demo application.
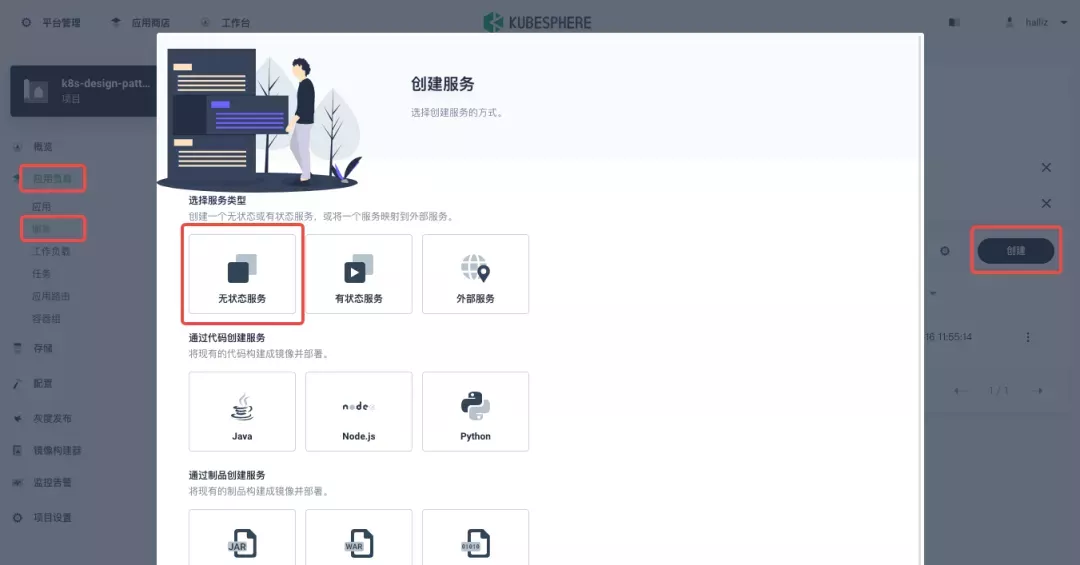
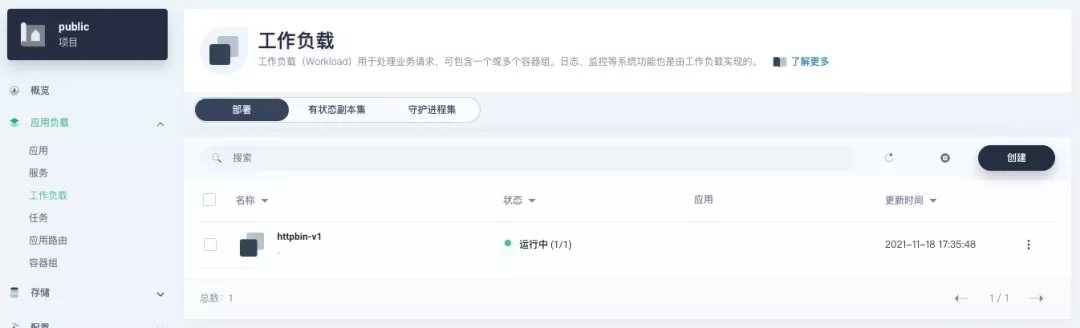
In KubeSphere, we can either create a new project or use an existing one. After entering the project page, select "Services" under "Application Loads" to directly create a stateless workload and generate a companion service.

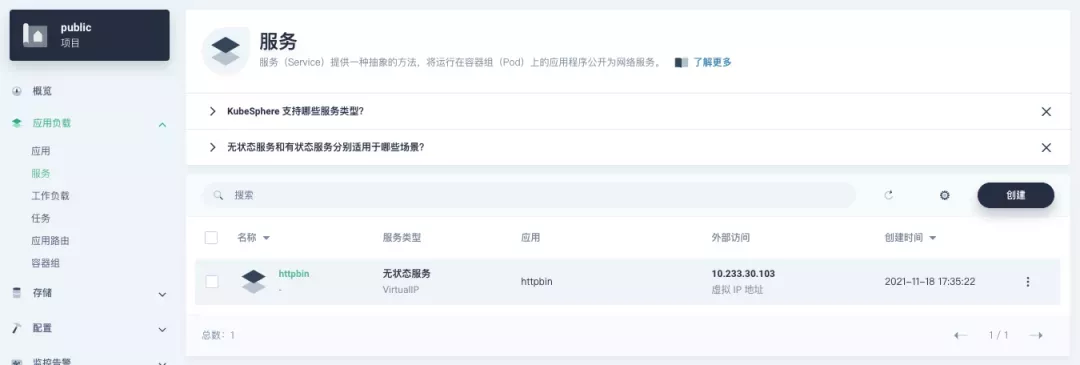
Use the default port 80 of the kennethreitz/httpbin container as the service port, and make sure you can see the corresponding entry for httpbin under both the Workloads and Services pages after creation, as shown in the following image.


Additional Project Gateway Details
The Project Gateway is a feature that has been live since KubeSphere 3.0. The Gateway in the KubeSphere Project is an NGINX Ingress controller. The mechanism built into KubeSphere for HTTP load balancing is called Application Routing, which defines the rules for connecting from the outside to the clustered service. To allow access to services from the outside, users can create routing resources to define URI paths, back-end service names, and other information.
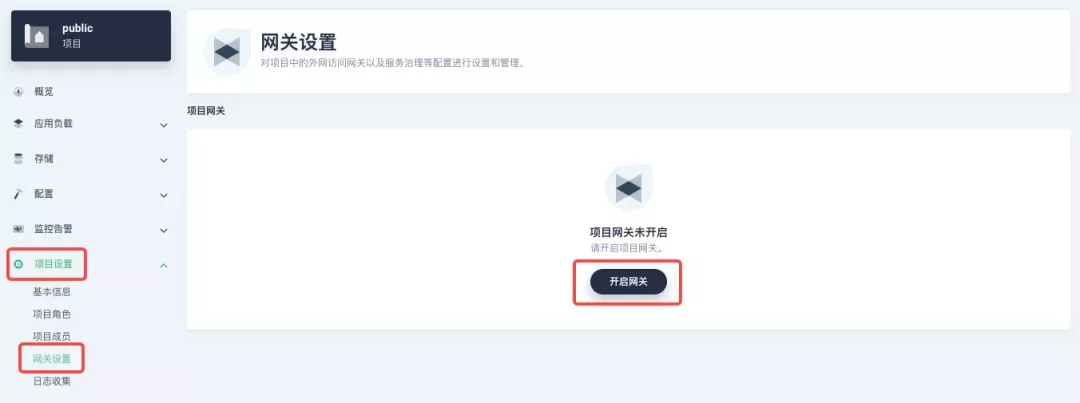
Following the httpbin service project deployed above, open the Gateway Settings page in Project Settings and perform the "Enable Gateway" operation. For convenience, just select NodePort as the "Access Method".

After complete the above operation, go back to the Gateway page, wait for a moment and refresh the page, you can get the deployment completion status as shown below, where you can see that NodePort is given two node ports by default. Next, we use the "Manage" button in the upper right corner to "View Details".
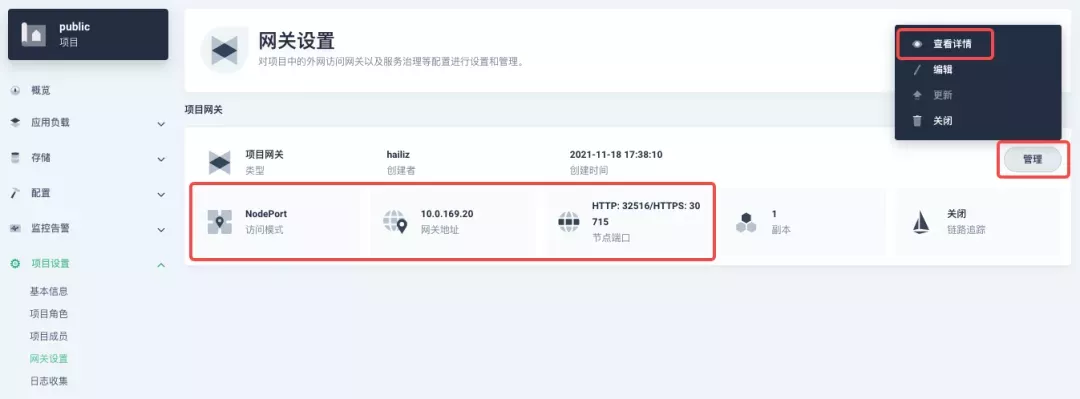

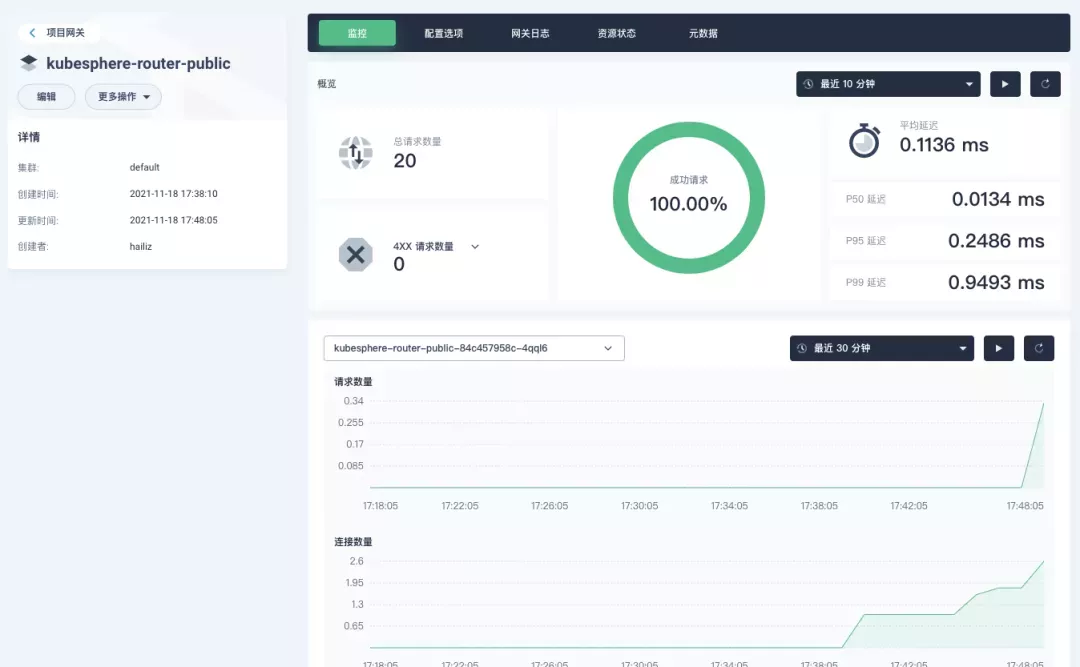
At this point we are looking at the new monitoring page for the project/cluster gateway in version 3.2.0. Next we need to create an application route for the httpbin service.
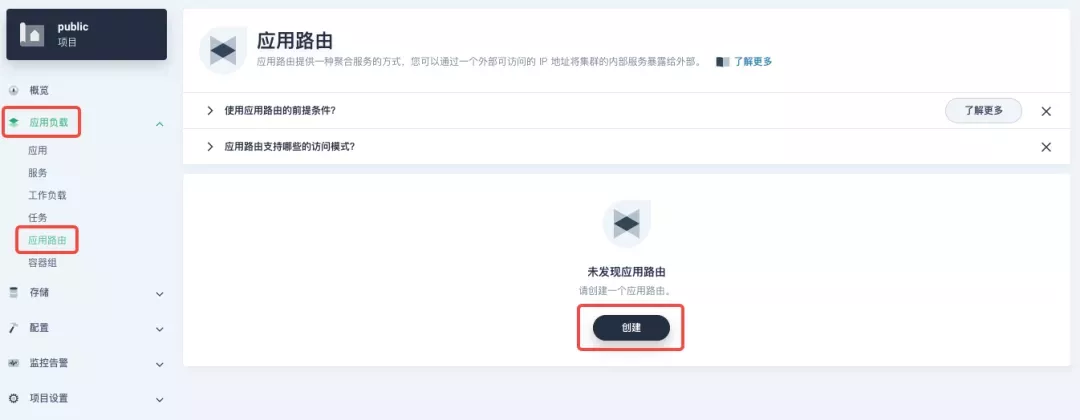
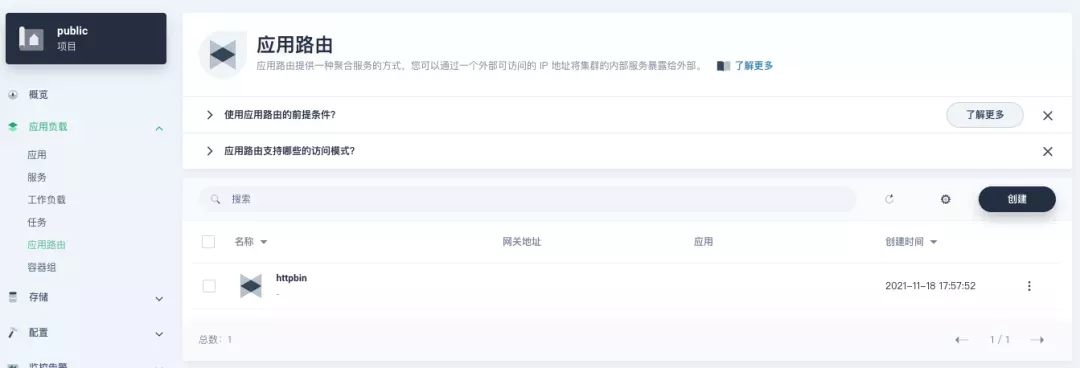
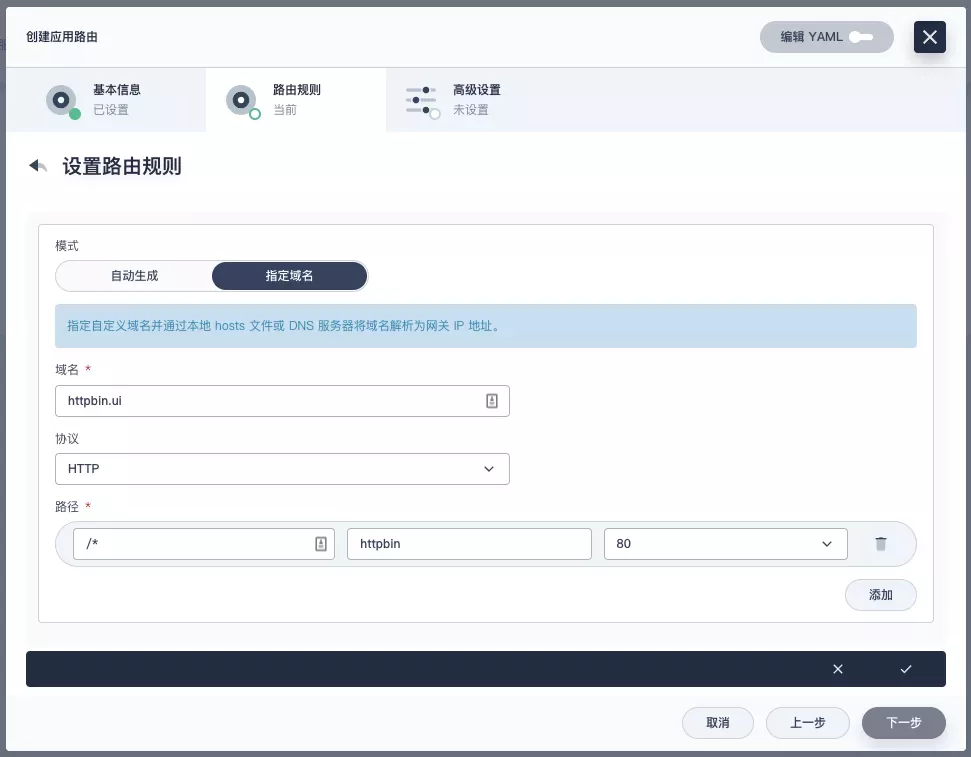
Go to the Application Routing page from Application Load and start "creating" the route. After naming the route httpbin, we specify a domain name for testing purposes and set the "path" to /, select "service" httpbin and "port" 80.

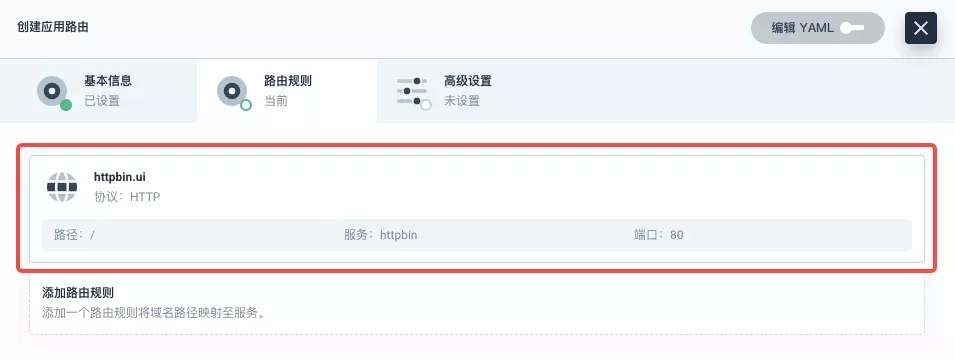

After skipping the advanced settings in the next step, the route creation is completed and you can get the httpbin application route entry as shown in the figure below.

Next, we can access the httpbin application service through the NodePort address of the project gateway and the specified domain name (e.g., http://httpbin.ui:32516 here), refresh or manipulate the request generation function of the page at will, and then enter the details page of the gateway, you can see that the "Monitoring" panel has appeared some built-in monitoring indicators.

Specifying the NodePort Node Port
For public cloud environments that use NodePort to expose access to the outside world, the open ports are usually limited and controlled, so we need to modify the NodePort used by the gateway.
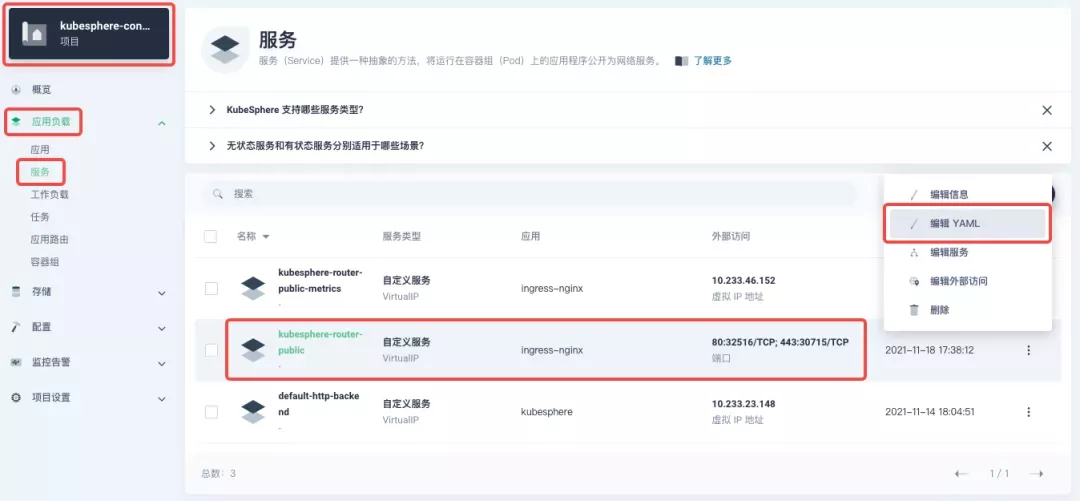
Since the gateway is managed by KubeSphere, to modify the NodePort of the gateway service, you need to have access to the kubesphere-controls-system project. Once inside the project, you can find the gateway service named kubesphere-router-<project-namespace> on the "Services" page under "Application Load", and the NodePort is open for external access.

Getting Started with Clustered Gateways
KubeSphere 3.2.0 supports global gateways at the cluster level, so all projects can share the same gateway, and previously created project gateways are not affected by the cluster gateway. Gateways for all projects can be managed and configured centrally, eliminating the need to switch to a different enterprise space to configure gateways.
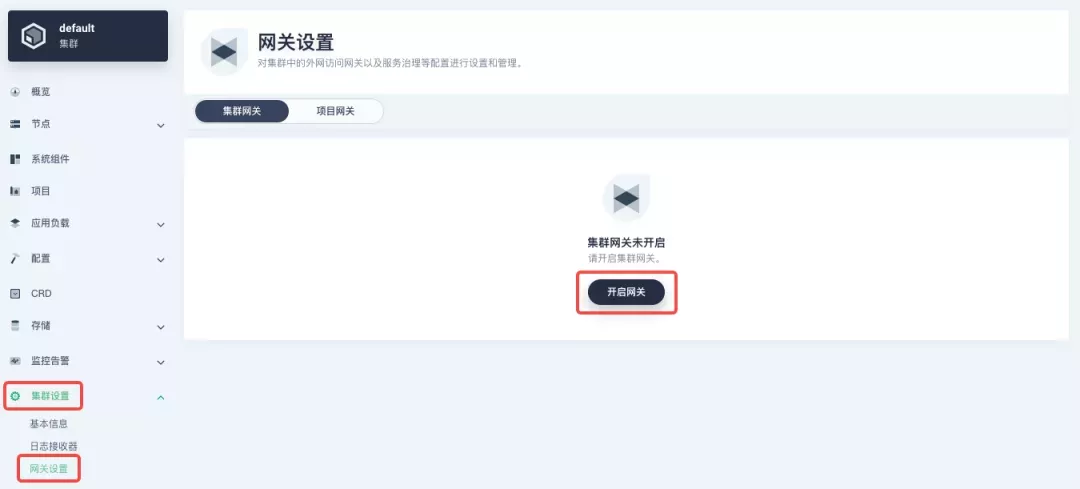
If you are using KubeSphere version 3.2.0, we recommend using the cluster gateway feature to unify the application routing across the cluster. To enable the cluster gateway, it's very simple: use an account with cluster management privileges to access one of the clusters you can manage (e.g. default cluster here), and under "Gateway Settings" in "Cluster Settings", you can "Enable Gateway" and view the "Project Gateway".

The way the cluster gateway is opened and the modification of the aligned NodePort access port are basically the same as the previous project gateway, so we won't go into details here.
However, there is one point that needs special attention: after the cluster gateway is opened, the gateway of the project that has been opened will remain; however, the project that has not yet created a gateway cannot create a separate gateway, and will use the cluster gateway directly.
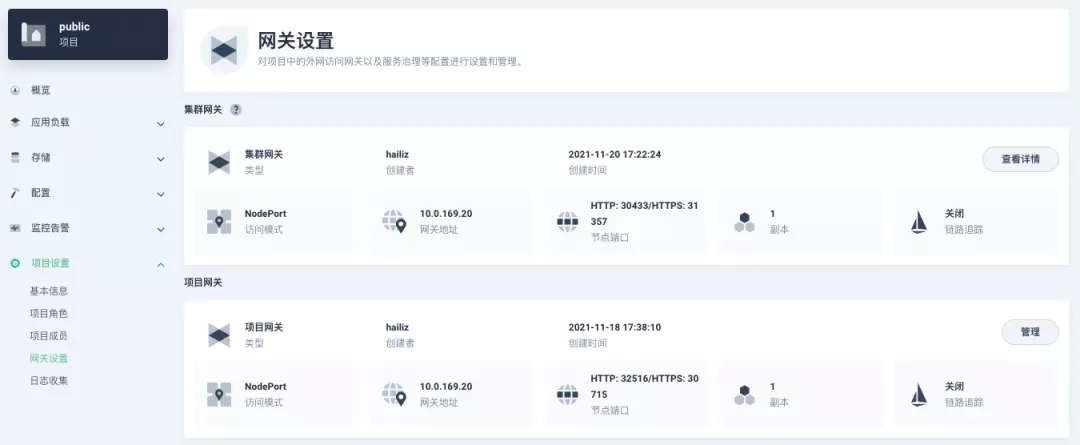
The following figure shows the overview of all gateways in the "Gateway Settings" page for projects that have already created gateways, after having both project and cluster gateways.

A Quick Look at Apache APISIX Ingress Controller
Apache APISIX is an open source, high-performance, dynamic cloud-native gateway donated to the Apache Foundation by Shenzhen Tributary Technology Co. in 2019, and is now the top open source project of the Apache Foundation and the most active gateway project on GitHub.Apache APISIX currently covers API gateways, LB Kubernetes Ingress, Service Mesh, and many other scenarios.
How to deploy
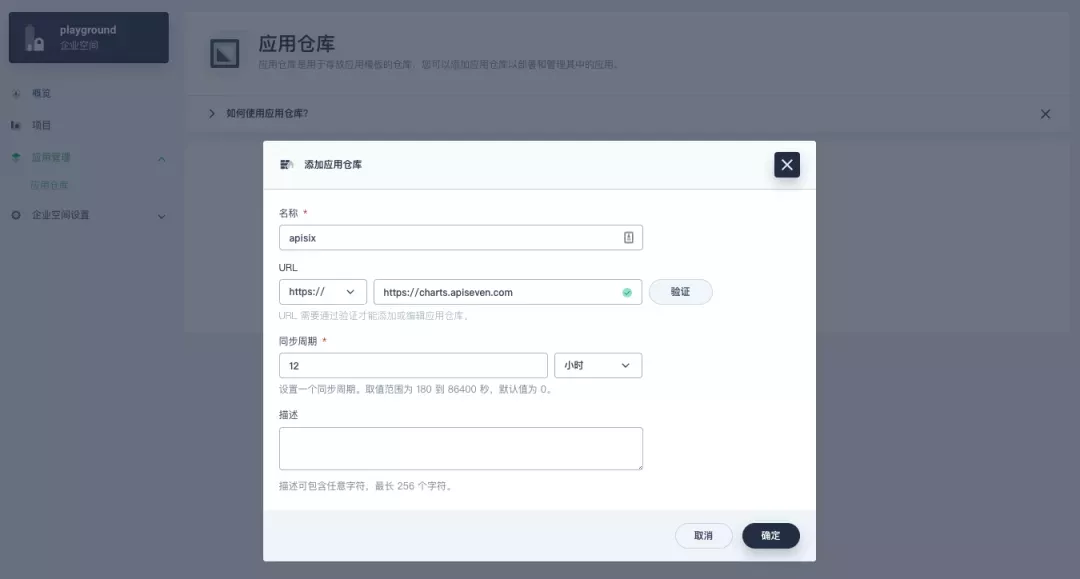
First add the Apache APISIX Helm Chart repository. After that, select an enterprise space and add the following Apache APISIX repository via "Application Repository" under "Application Management".

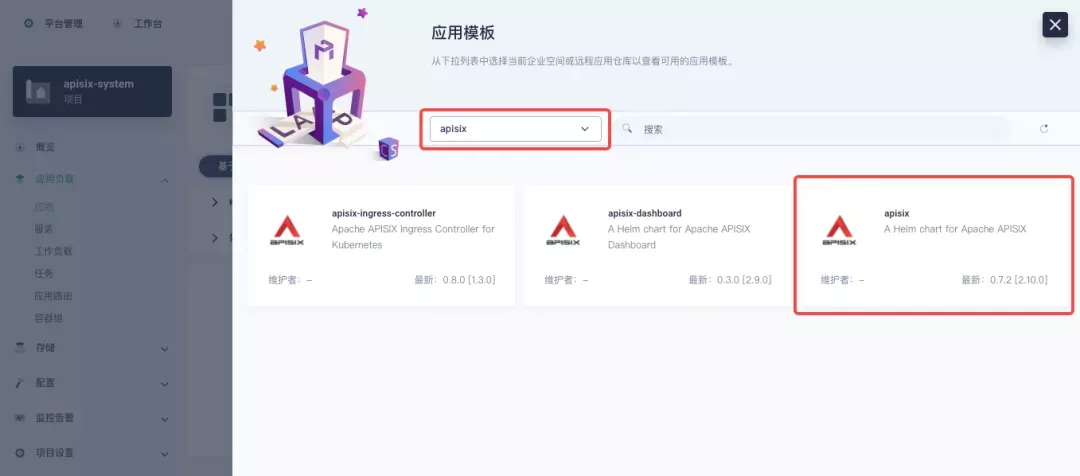
Next, create a project named apisix-system. Once you are on the project page, select the Create an Application in Application Load method to deploy Apache APISIX, and select the apisix application template to start the deployment.

Why deploy the Apache APISIX application Helm Chart directly instead of deploying the Apache APISIX Ingress Controller directly?
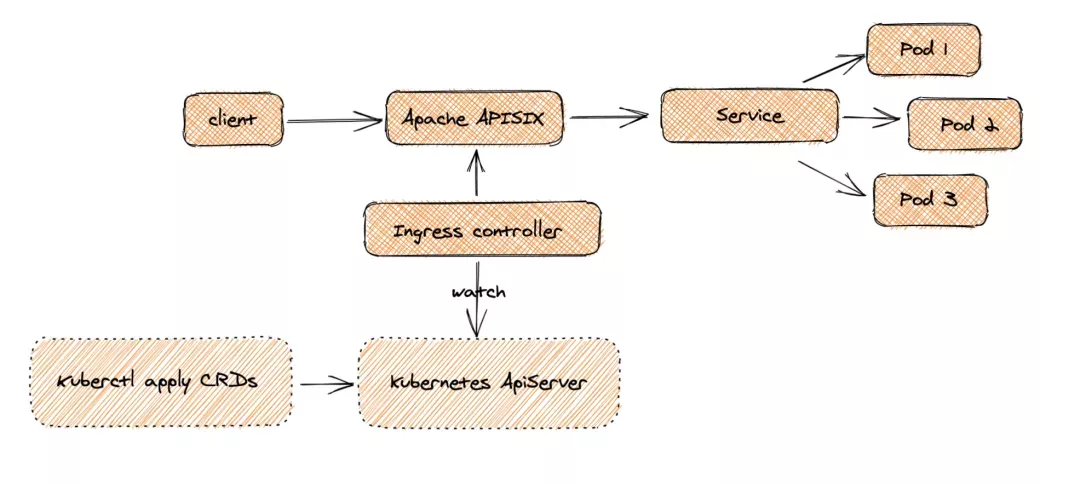
This is because the Apache APISIX Ingress Controller is currently strongly associated with the Apache APISIX Gateway (as shown in the figure below), and it is currently most convenient to deploy Apache APISIX Gateway + Dashboard + Ingress Controller through Apache APISIX Helm Charts at the same time. Ingress Controller is the most convenient, so this article recommends using Apache APISIX Helm Charts directly for the deployment of the whole set of components.

Name the application apisix to avoid mismatches between workloads and service names of multiple components (Gateway, Dashboard, Ingress Controller); in the "Application Settings" section edited in the installation steps, please fill in the following configuration (please pay special attention to the notes marked with [Note], the rest (The rest can be edited and modified by yourself as needed).
global:
  imagePullSecrets: []

apisix:
  enabled: true
  customLuaSharedDicts: []
  image:
    repository: apache/apisix
    pullPolicy: IfNotPresent
    tag: 2.10.1-alpine
  replicaCount: 1
  podAnnotations: {}
  podSecurityContext: {}
  securityContext: {}
  resources: {}
  nodeSelector: {}
  tolerations: []
  affinity: {}
  podAntiAffinity:
    enabled: false

nameOverride: ''
fullnameOverride: ''

gateway:
  type: NodePort
  externalTrafficPolicy: Cluster
  http:
    enabled: true
    servicePort: 80
    containerPort: 9080
  tls:
    enabled: false
    servicePort: 443
    containerPort: 9443
    existingCASecret: ''
    certCAFilename: ''
    http2:
      enabled: true
  stream:
    enabled: false
    only: false
    tcp: []
    udp: []
  ingress:
    enabled: false
    annotations: {}
    hosts:
      - host: apisix.local
        paths: []
    tls: []

admin:
  enabled: true
  type: ClusterIP
  externalIPs: []
  port: 9180
  servicePort: 9180
  cors: true
  credentials:
    admin: edd1c9f034335f136f87ad84b625c8f1
    viewer: 4054f7cf07e344346cd3f287985e76a2
  allow:
    ipList:
      - 0.0.0.0/0

plugins:
  - api-breaker
  - authz-keycloak
  - basic-auth
  - batch-requests
  - consumer-restriction
  - cors
  - echo
  - fault-injection
  - grpc-transcode
  - hmac-auth
  - http-logger
  - ip-restriction
  - ua-restriction
  - jwt-auth
  - kafka-logger
  - key-auth
  - limit-conn
  - limit-count
  - limit-req
  - node-status
  - openid-connect
  - authz-casbin
  - prometheus
  - proxy-cache
  - proxy-mirror
  - proxy-rewrite
  - redirect
  - referer-restriction
  - request-id
  - request-validation
  - response-rewrite
  - serverless-post-function
  - serverless-pre-function
  - sls-logger
  - syslog
  - tcp-logger
  - udp-logger
  - uri-blocker
  - wolf-rbac
  - zipkin
  - traffic-split
  - gzip
  - real-ip
  # [note] add this plug-in to cooperate with Dashboard to display service information
  - server-info

stream_plugins:
  - mqtt-proxy
  - ip-restriction
  - limit-conn

customPlugins:
  enabled: true
  luaPath: /opts/custom_plugins/?.lua
  # [note] the following configuration ensures that the Prometheus plug-in can expose indicators to the outside world.
  plugins:
   - name: prometheus
     attrs:
       export_addr:
         ip: 0.0.0.0
          port: 9091
      configMap:
       name: prometheus
        mounts: []

dns:
  resolvers:
    - 127.0.0.1
    - 172.20.0.10
    - 114.114.114.114
    - 223.5.5.5
    - 1.1.1.1
    - 8.8.8.8
  validity: 30
  timeout: 5

autoscaling:
  enabled: false
  minReplicas: 1
  maxReplicas: 100
  targetCPUUtilizationPercentage: 80
  targetMemoryUtilizationPercentage: 80

configurationSnippet:
  main: ''
  httpStart: ''
  httpEnd: ''
  httpSrv: ''
  httpAdmin: ''
  stream: ''

etcd:
  enabled: true
  host:
    - 'http://etcd.host:2379'
  prefix: /apisix
  timeout: 30
  auth:
    rbac:
      enabled: false
      user: ''
      password: ''
    tls:
      enabled: false
      existingSecret: ''
      certFilename: ''
      certKeyFilename: ''
      verify: true
  service:
    port: 2379
  replicaCount: 3

dashboard:
  enabled: true
  # [note] Enable NodePort for Dashboard to facilitate subsequent use
  service:
   type: NodePort

ingress-controller:
  enabled: true
  config:
    apisix:
     # [note] Be sure to set the namespace where gateway is located
      serviceNamespace: apisix-system
  serviceMonitor:
    enabled: true
    namespace: 'apisix-system'
    interval: 15s
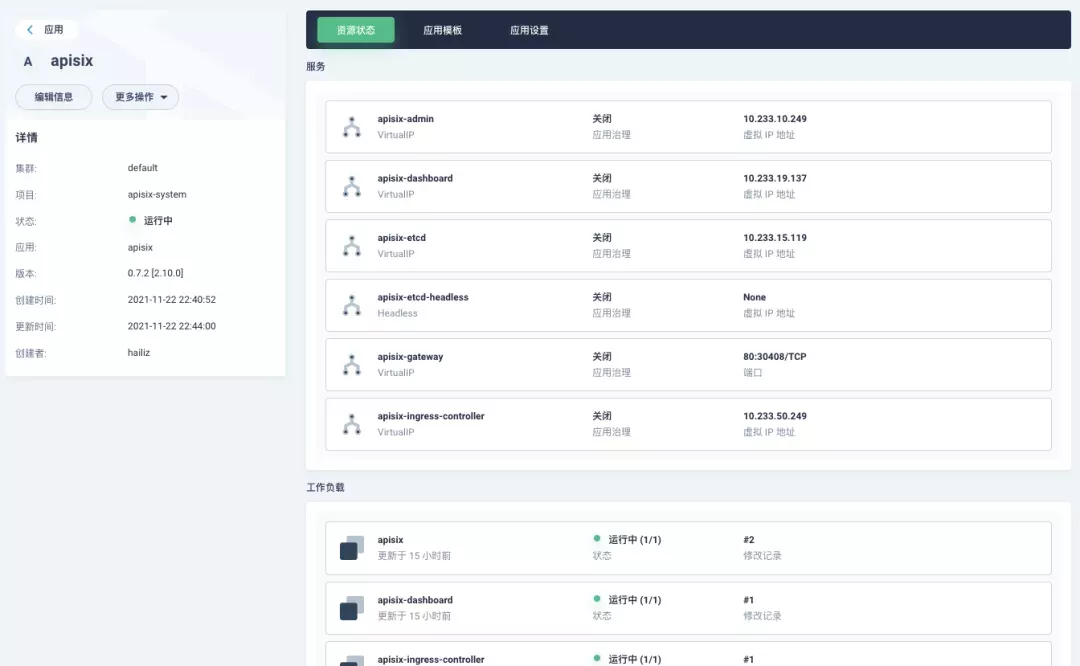
After successful deployment, click the application name to enter the details page, and you can see the following service deployment and working status operation status display under the "Resource Status" tab.

note
The default configuration parameters for the other two Helm Charts of the Apache APISIX project can be found in Dashboard and Ingress Controller values.yaml.
Dashboard Usage
After the Apache APISIX application is deployed, you can check the current status of the Apache APISIX gateway through the Apache APISIX Dashboard.
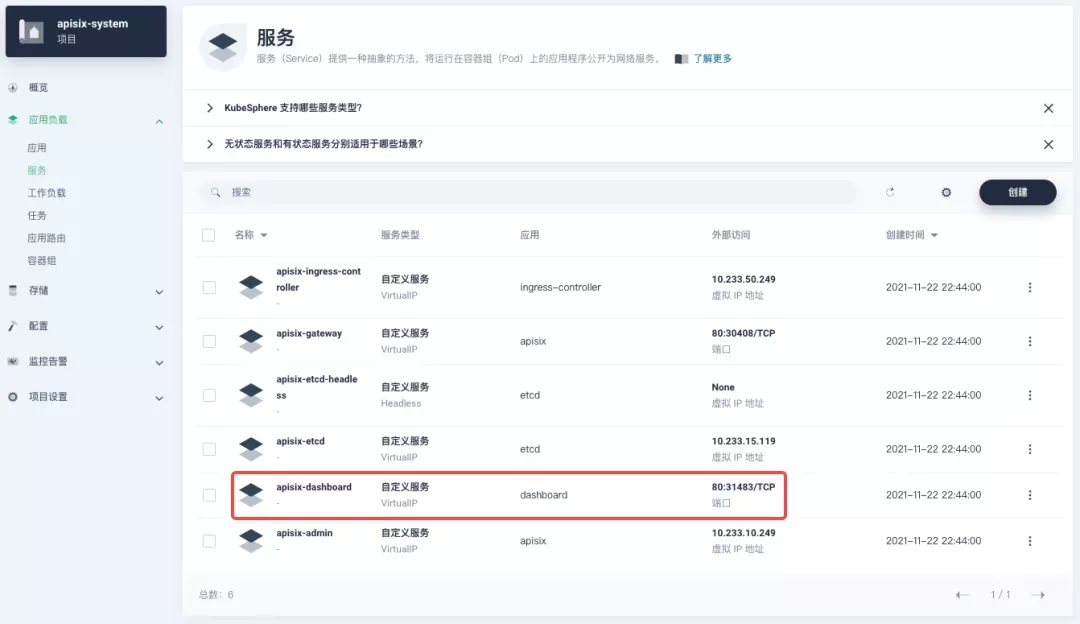
You can find the apisix-dashboard service from the application load-services page. Since we have enabled NodePort for Dashboard in the application configuration, you can access Dashboard directly through the NodePort port here.

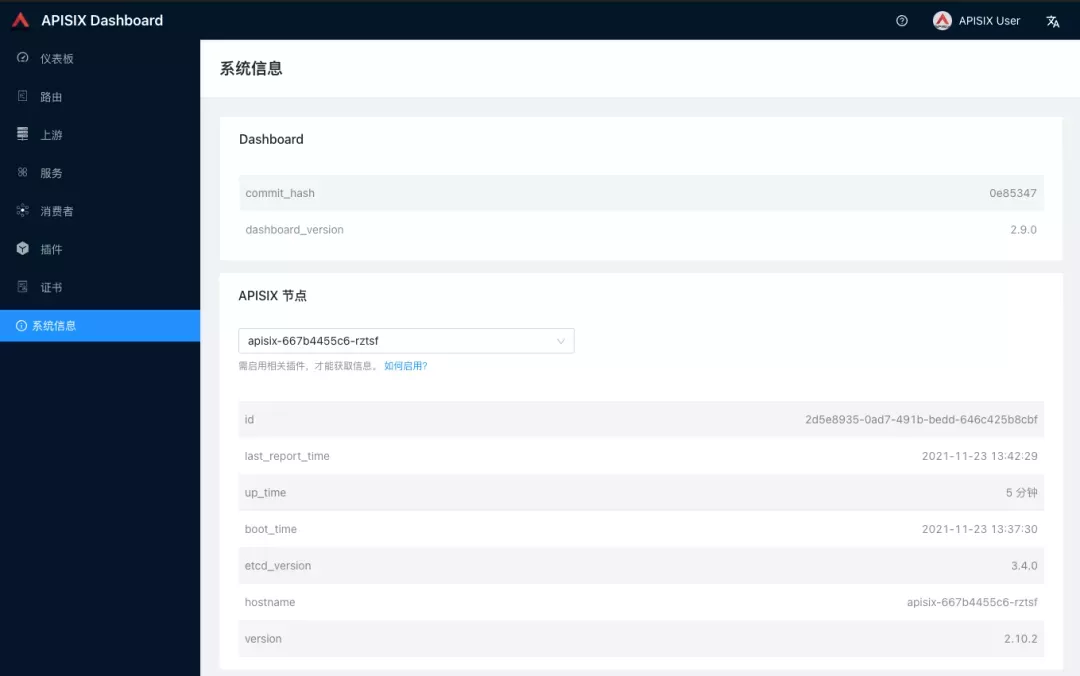
Log in to the Apache APISIX Dashboard with the default user name and password admin, and you can enter the System Information page to view the information of Apache APISIX nodes currently connected to management.

How to use
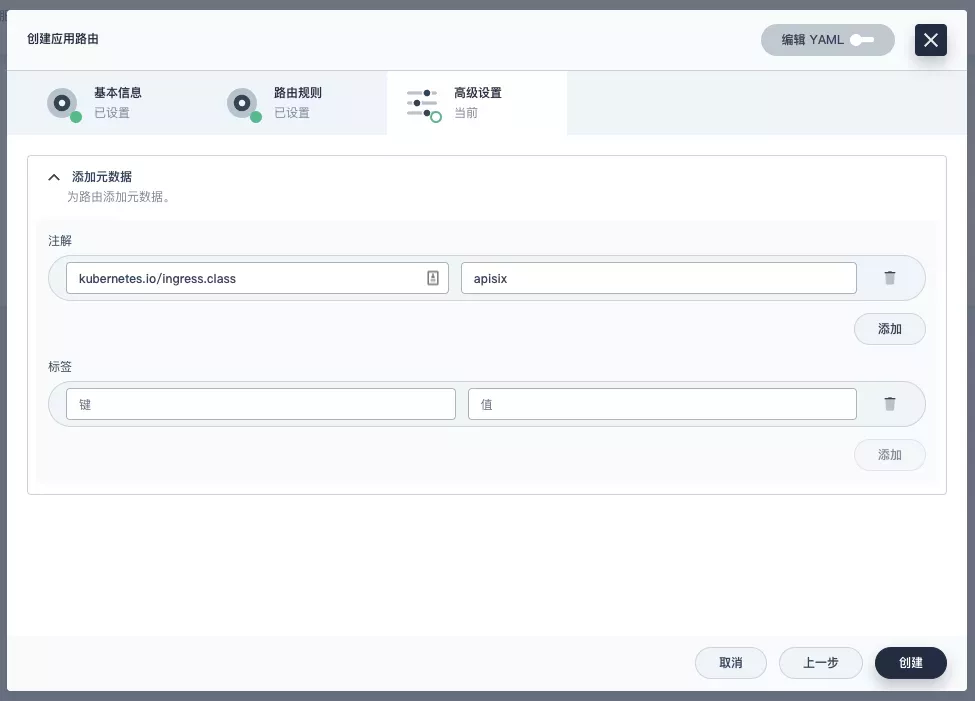
Next, let's go back to the "Apply Routes" page, create another route (e.g. apisix-httpbin), set the path to /* httpbin 80 and add the key kubernetes.io/ingress.class: apisix to it.


Verify that the application route is effective
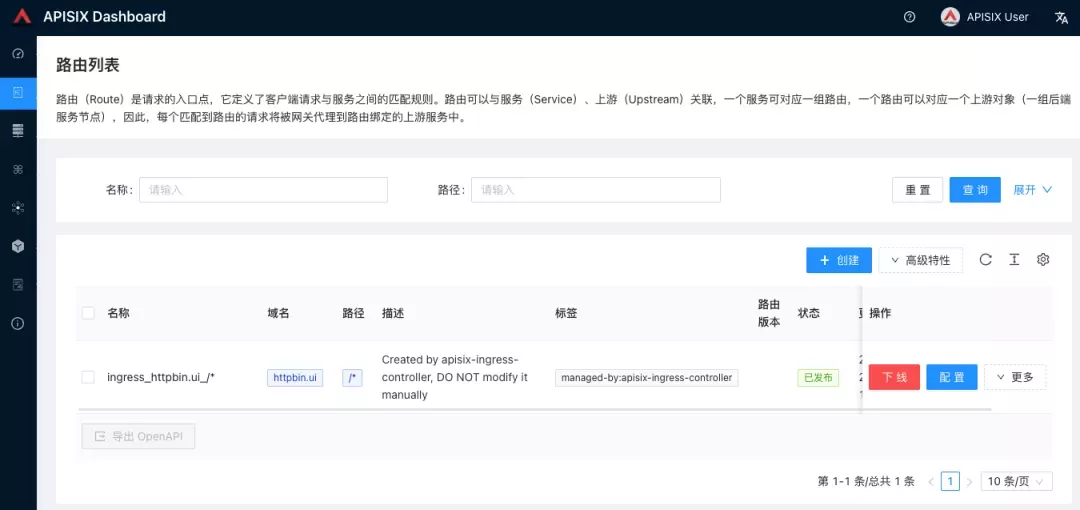
Go back to the Apache APISIX Dashboard and enter the "Routes" page. You can see that the newly created application route has been recognized by the Apache APISIX Ingress Controller and automatically added to the Apache APISIX gateway, and you can also see an automatically created upstream entry in the "Upstream" page.

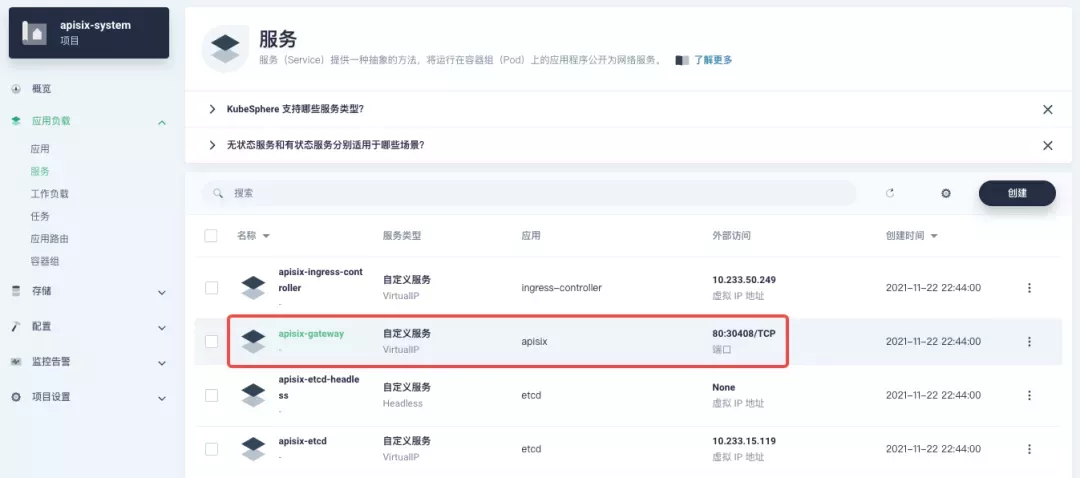
Next, go back to the apisix-system project "Services" page, find the port corresponding to the apisix-gateway service, and access <apisix-httpbin application routing domain name>:<apisix-gateway external access port> (for example, httpbin.ui:30408 here) to access the backend service associated with the apisix-httpbin application route.

Custom Monitoring of Apache APISIX Gateways
Monitoring capabilities can be augmented when using the Apache APISIX gateway through the Prometheus plug-in and the custom monitoring capabilities that come with KubeSphere.
Exposing relevant Prometheus monitoring metrics
Since we have already enabled the Prometheus plugin when deploying the Apache APISIX application, we only need to expose the interface to the Prometheus monitoring metrics.
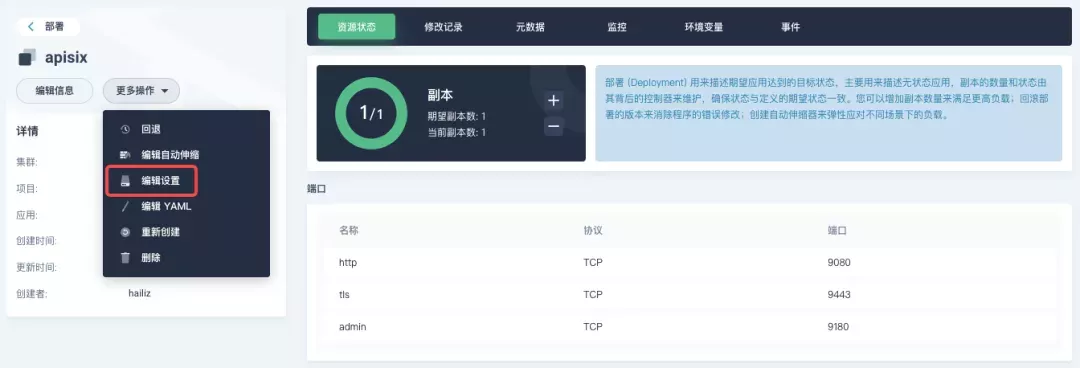
Go to the apisix-system project, find apisix on the "Workloads" page and go to the deployment details page, then select "Edit Settings" from "More Actions" in the left action panel.
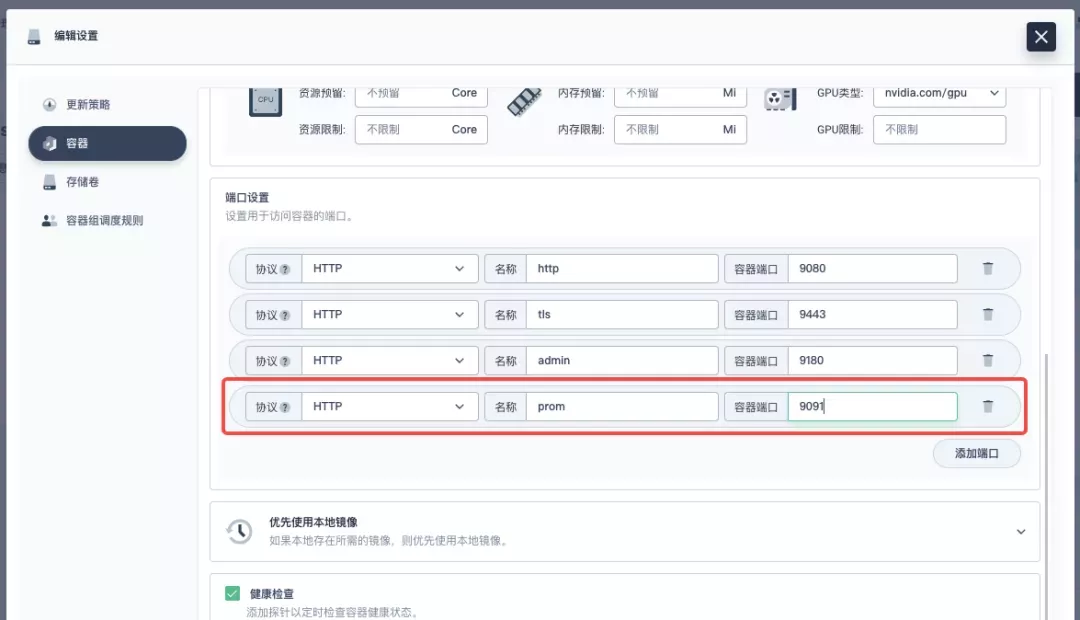
In the pop-up panel, go to the apisix container editing interface, find "Port Settings", add a new port named prom to map to port 9091 of the container, save it and the apisix workload will restart.

Creating a ServiceMonitor for monitoring metrics
Next, we need to connect the exposed metrics interface to KubeSphere's own Prometheus to make it accessible (to grab the metrics data).
Since KubeSphere maintains the internal Prometheus system through the Prometheus Operator, the quickest way to access the metrics is to create a ServiceMonitor resource directly.
apiVersion: monitoring.coreos.com/v1
kind: ServiceMonitor
metadata:
  name: apisix
  namespace: apisix-system
spec:
  endpoints:
    - scheme: http
     # [note] use the container port name exposed by the workload in the previous step
     targetPort: prom
     # [note] you need to bind the metric interface path corresponding to apisix correctly.
     path: /apisix/prometheus/metrics
      interval: 15s
  namespaceSelector:
    matchNames:
      - apisix-system
  selector:
    matchLabels:
      app.kubernetes.io/name: apisix
      app.kubernetes.io/version: 2.10.0
      helm.sh/chart: apisix-0.7.2
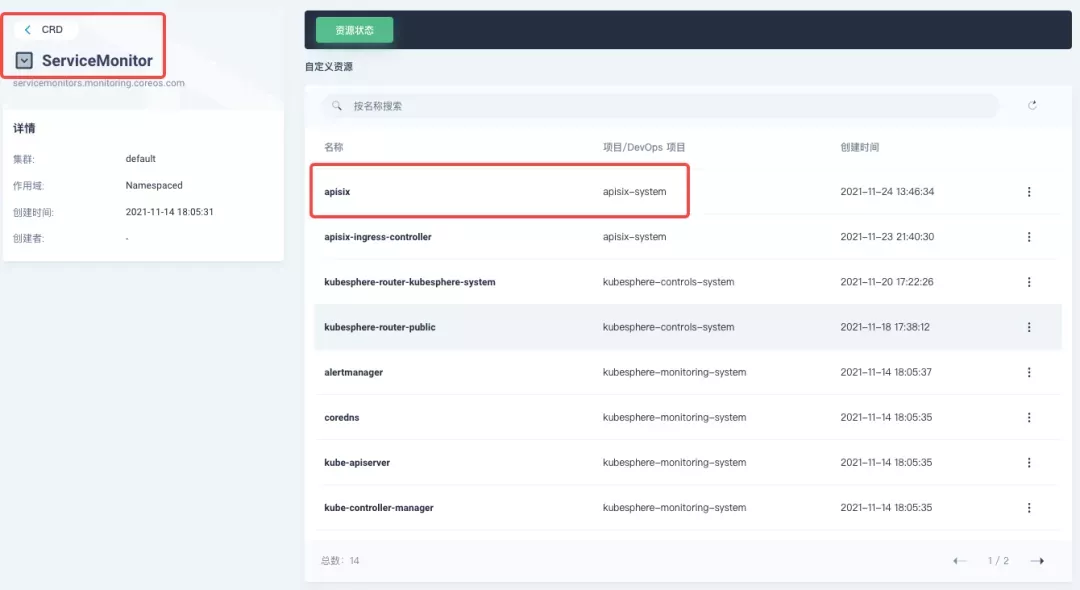
Create the ServiceMonitor resource using kubectl apply -f your_service_monitor.yaml. Once created, you can also search for the ServiceMonitor resource in the cluster's CRD management page and find a custom resource named apisix, if you have cluster management privileges, and make subsequent YAML changes here.

Indicator access to custom monitoring panel
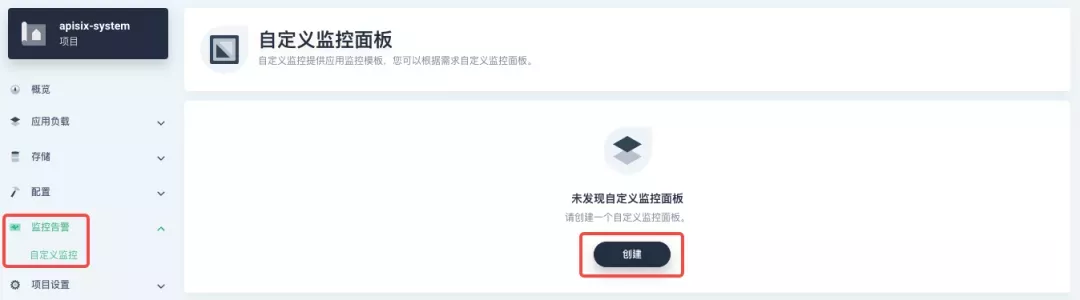
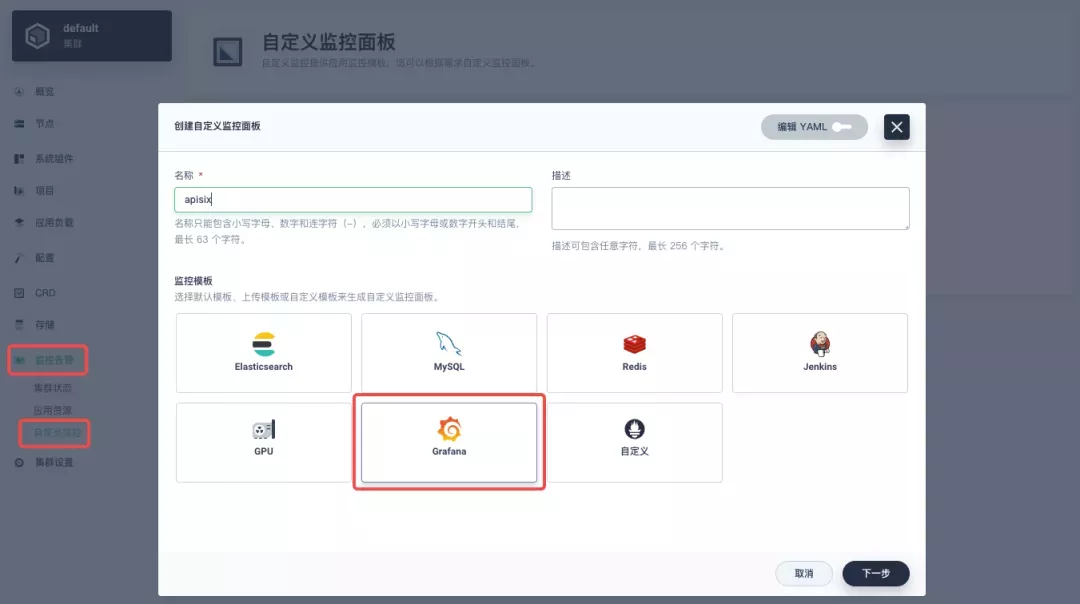
Find "Custom Monitoring" under "Monitoring Alarms" in the menu list on the left side of the project, and start to "create" custom monitoring panels.

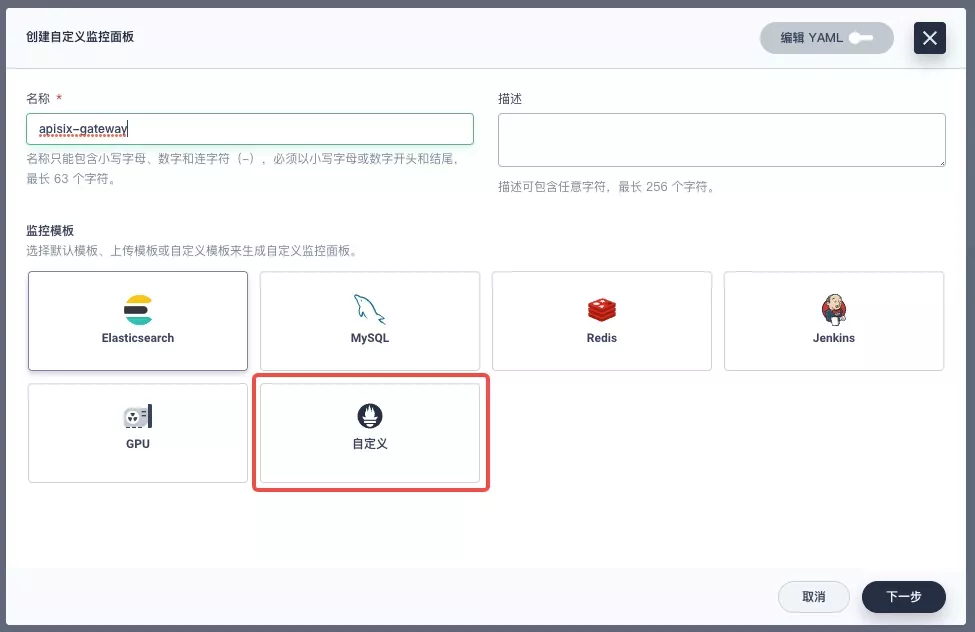
Fill in "Name" in the pop-up window, select "Custom" monitoring template, and go to "Next" to create the monitoring panel.

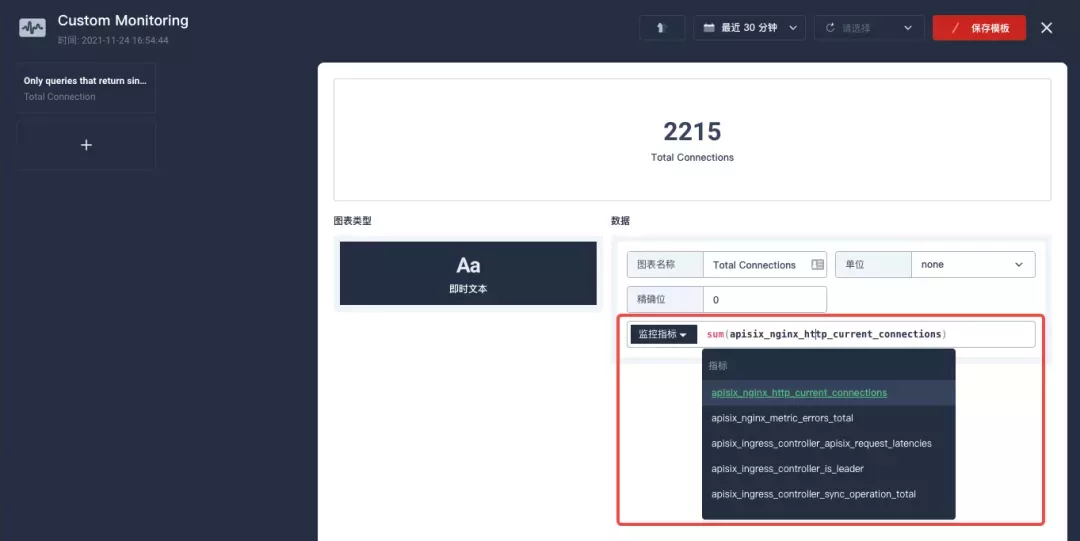
After entering the edit page now click on the + area on the left side and configure the Prometheus monitoring metrics in the "Data" area on the right side. For example, here we can use sum(apisix_nginx_http_current_connections) to count the total number of connections to the Apache APISIX gateway in real time.

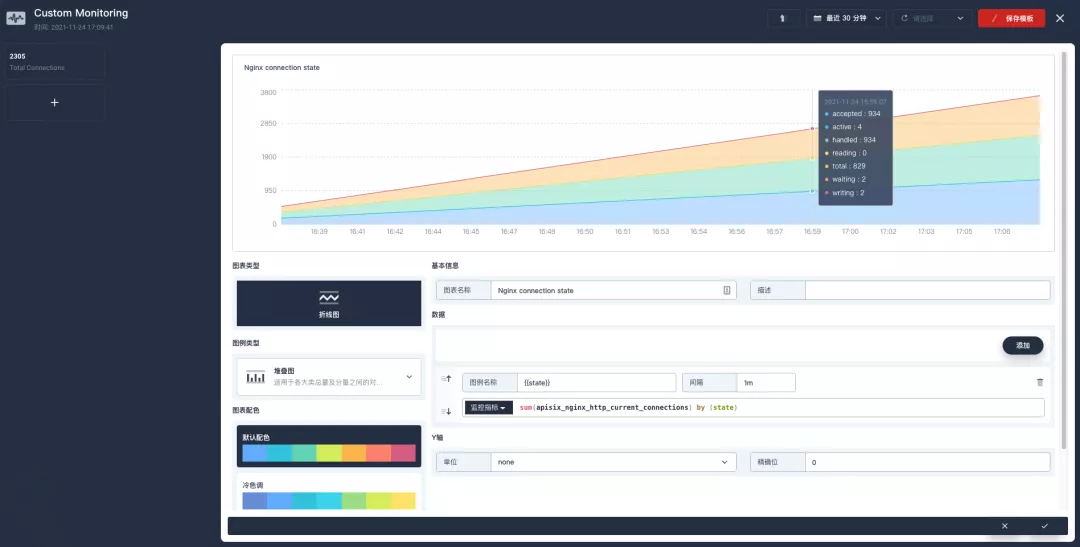
After saving, find "+ Add monitoring item" in the bottom-right corner of the page and select "Line Chart" to create the Nginx connection state metric: use sum(apisix_nginx_http_current_connections) by (state) as the metric, {{state}} as the legend name, and "Legend type" as the stacked graph to get a result similar to the one below. Save the template and get your first custom monitoring panel!

The Prometheus metrics currently provided by the Apache APISIX gateway can be found in the available metrics section of the official documentation.
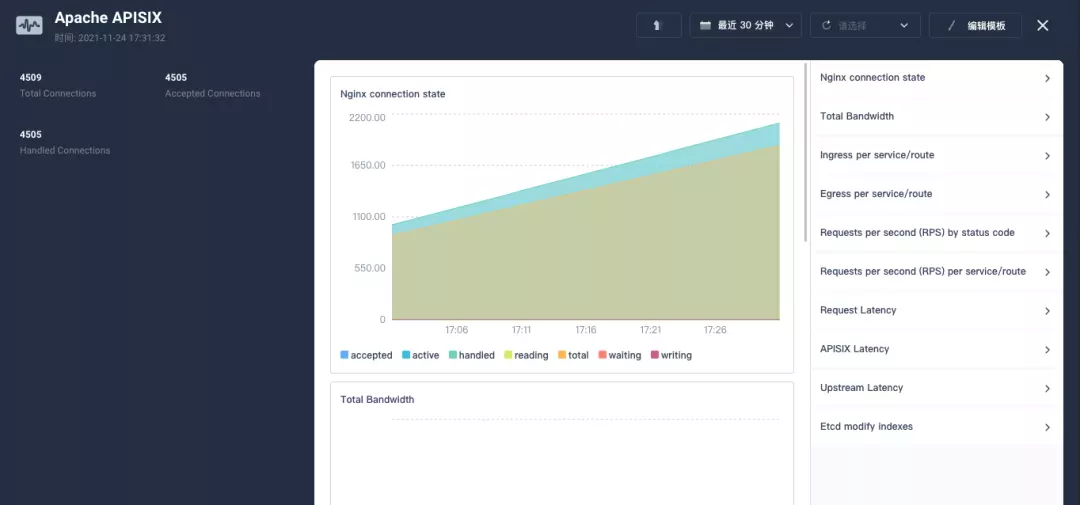
Since the metrics configuration process is a bit tricky, it is recommended to import the Apache APISIX Grafana template directly from the cluster-level "Custom Monitoring" (download the JSON and import it via "Local Upload").

KubeSphere is also actively working on introducing the Grafana template import into the project's custom monitoring capabilities, so stay tuned!

Summary
This article is a very detailed step-by-step guide for you to fully understand and follow along with how to "interoperate Apache APISIX Ingress gateway with KubeSphere and perform custom monitoring". We hope that reading this article will deepen your understanding of Apache APISIX Ingress Controller and Apache APISIX application.