

The author of this article, Zhendong Qi, is from China Mobile Cloud Competence Center. He has extensive experience in distributed object storage software development and has participated in the construction of several resource pools in the mobile cloud. This article describes how community contributor Zhendong Qi contributed
clickhouse-loggerto Apache APISIX and how he used the plugin to simplify the business architecture and improve the efficiency of logging.
Background Information
Apache APISIX is a dynamic, real-time, high-performance API gateway that provides rich traffic management features such as load balancing, dynamic upstream, canary release, circuit breaking, authentication, observability, and more. It not only has many useful plugins, but also supports plugin dynamic change and hot reload.
Developed by Yandex and open sourced in 2016, ClickHouse is not only a database, but also a database management system that allows creating tables and databases, loading data and running queries at runtime without reconfiguring or restarting services.
As more and more companies start to migrate their business to the cloud, how to efficiently implement log sending and receiving and log analysis to enhance the observabilities of the system becomes a challenge. China Mobile Cloud Competence Center, as a company providing public cloud services, the architecture of the initial Apache APISIX-based business log sending and receiving and analysis system is roughly like this.
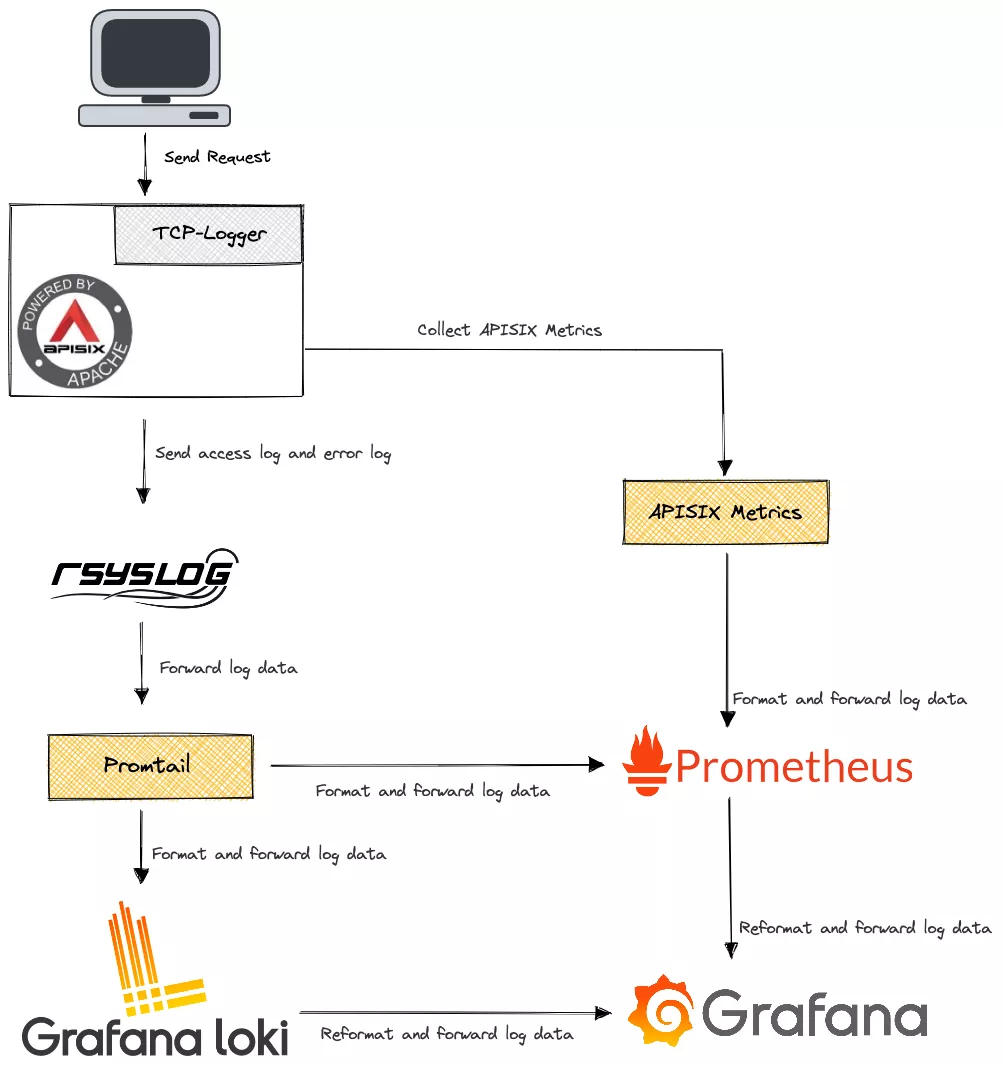

As the business grows, the above solution is not only oddly expensive to maintain, but also difficult to meet our needs for fine-grained data analysis. Since the data received by rsyslog is a string rather than a JSON format log, it makes log analysis difficult.
There is a famous saying in computing that "any problem can be solved by adding an indirect middle layer". We actually considered adding another intermediate layer between tcp-logger and rsyslog to convert strings to JSON, but this is obviously not a permanent solution.
So let's look at the problem differently: if we consider the existing architecture of "tcp-logger+rsyslog+Promtail+Loki" as a huge middle layer, then no matter how many additional middle layers we add in between, it only solves the immediate problem. In the meantime, it makes it more bloated and difficult to maintain. Is there a product on the market that can directly replace "tcp-logger+rsyslog+Promtail+Loki"?
With this question in mind, we spent some time researching and ended up choosing ClickHouse for several reasons.
- ClickHouse provides HTTP interface for easy calling of other modules.
- ClickHouse-based analysis toolbox is very mature and can meet our needs for log analysis.
- ClickHouse supports the use of object storage as a storage engine, very convenient.
- There is no need to repeat the "tool-building" process.
There is only one problem left to solve: how to implement the interface between Apache APISIX and ClickHouse? A good way to do this is in the form of a plugin. As a member of the Apache APISIX community, I rarely speak up in the community. Seeing the recent progress in the ecosystem of Apache APISIX, I was actually a bit excited to use Apache APISIX, but I haven't contributed any code to the community yet, so I thought I'd like to take this opportunity to add some fire to the community's ecosystem development.
How It Works
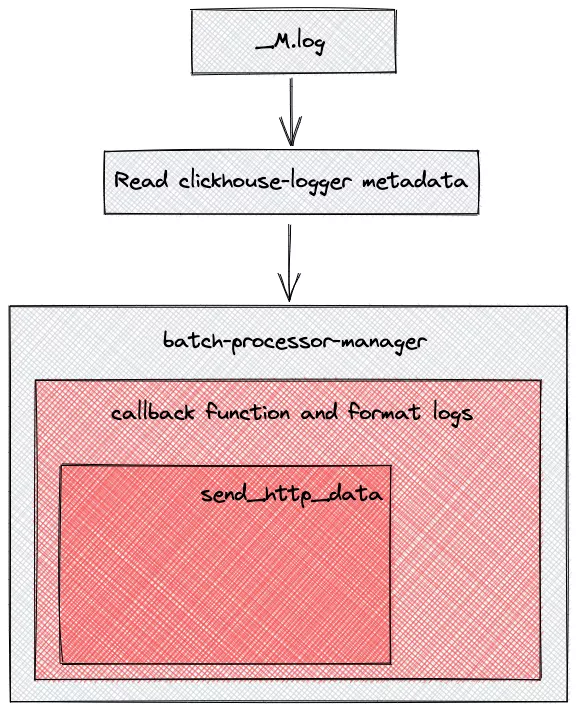
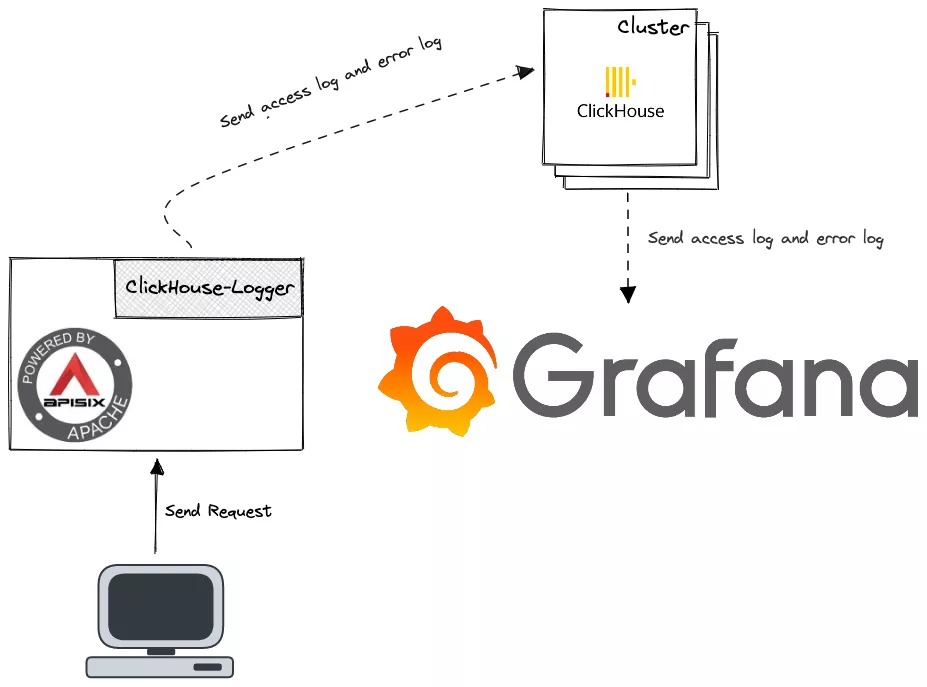
The clickhouse-logger plugin acts as an middle layer between Apache APISIX and ClickHouse. As mentioned above, we use Apache APISIX as a seven-layer load balancer and requests passing through Apache APISIX generate logs, such as access log and error log. The clickhouse-logger collects the logs and organizes them according to the log format set by its own metadata. Finally, it relies on a batch processor to send the collated logs to ClickHouse in bulk.
clickhouse-logger serves as a replacement for "tcp-logger+rsyslog+Promtail+Loki" in our scenario. Eliminating the need for format conversion and data forwarding between multiple components, log data requests can be pushed directly to the ClickHouse server.

How to Use the ClickHouse Plugin
Here is a sample process to enable the clickhouse-logger plugin in a route.
Enable the ClickHouse Plugin
Run the curl command to enable the clickhouse-logger plugin for the specified route.
curl http://127.0.0.1:9080/apisix/admin/routes/1 \
-H 'X-API-KEY: edd1c9f034335f136f87ad84b625c8f1' -X PUT -d '
{
      "plugins": {
            "clickhouse-logger": {
                "user": "default",
                "password": "a",
                "database": "default",
                "logtable": "test",
                "endpoint_addr": "http://127.0.0.1:8123"
            }
       },
      "upstream": {
           "type": "roundrobin",
           "nodes": {
               "127.0.0.1:1980": 1
           }
      },
      "uri": "/hello"
}'
The parameters of clickhouse-logger are listed in the chart below.
| Name | Type | Required | Default Value | Range | Description |
|---|---|---|---|---|---|
| endpoint_addr | string | Yes | n/a | n/a | ClickHouse server endpoint. |
| database | string | Yes | n/a | n/a | The database used. |
| logtable | string | Yes | n/a | n/a | The name of the table to write to. |
| user | string | Yes | n/a | n/a | User for ClickHouse. |
| password | string | Yes | n/a | Password for ClickHouse. | |
| timeout | integer | No | 3 | [1,...] | The time to keep the connection active after sending the request. |
| name | string | No | "clickhouse-logger" | n/a | A unique identifier that identifies the logger. |
| batch_max_size | integer | No | 100 | [1,...] | Set the maximum number of logs to be sent each time, and when the maximum number of logs reaches the set value, all logs will be automatically pushed to clickhouse. |
| max_retry_count | integer | No | 0 | [0,...] | Maximum number of retries before being removed from the processing pipeline. |
| retry_delay | integer | No | 1 | [0,...] | If the execution fails, the execution of the process should be delayed for a number of seconds. |
| ssl_verify | boolean | No | true | [true,false] | Validate the certificate. |
Test the ClickHouse Plugin
Use the
curlcommand to test the plugin.curl -i http://127.0.0.1:9080/helloIf the following result is returned, it means it is successfully enabled.
HTTP/1.1 200 OK
...
hello, world
Advanced Skill: Configure Log Format
You can set a custom log format using the log_format metadata, as shown in the example below.
Configure the
log_formatmetadata parameter.curl http://127.0.0.1:9080/apisix/admin/plugin_metadata/clickhouse-logger \
-H 'X-API-KEY: edd1c9f034335f136f87ad84b625c8f1' -X PUT -d '
{
"log_format": {
"host": "$host",
"@timestamp": "$time_iso8601",
"client_ip": "$remote_addr"
}
}'Declare the log format as a key-value pair in JSON format. For the value part, only strings are supported. If it starts with
$, it indicates that it is to get APISIX built-in variables or Nginx built-in variables. In particular, this setting is global, meaning that specifyinglog_formatwill take effect on all routes or services bound tohttp-logger.Create a table for ClickHouse to write in.
CREATE TABLE default.test (
  `host` String,
  `client_ip` String,
  `route_id` String,
  `@timestamp` String,
  PRIMARY KEY(`@timestamp`)
) ENGINE = MergeTree()Execute
select * from default.test;on ClickHouse, you will get data similar to the following.┌─host──────┬─client_ip─┬─route_id─┬─@timestamp────────────────┐
│ 127.0.0.1 │ 127.0.0.1 │ 1 │ 2022-01-17T10:03:10+08:00 │
└───────────┴───────────┴──────────┴───────────────────────────┘
Advanced Skill: Connect Grafana with ClickHouse
Enable the clickhouse-logger plugin globally.
curl http://127.0.0.1:9080/apisix/admin/global_rules/1 \
-H 'X-API-KEY: edd1c9f034335f136f87ad84b625c8f1' -X PUT -d '
{
    "plugins": {
        "clickhouse-logger": {
            "timeout": 3,
            "retry_delay": 1,
            "batch_max_size": 100,
            "user": "default",
            "password": "a",
            "database": "default",
            "logtable": "t",  "max_retry_count": 1,
            "endpoint_addr": "http://127.0.0.1:8123"
        }
    }
}'Configure the log_format metadata parameter. log_format must be in the same format as the database table structure, otherwise it will cause write failure.
 curl http://127.0.0.1:9080/apisix/admin/plugin_metadata/clickhouse-logger \
-H 'X-API-KEY: edd1c9f034335f136f87ad84b625c8f1' -X PUT -d '
{
    "log_format": {
        "upstream_header_time": "$upstream_header_time",
        "upstream_connect_time": "$upstream_connect_time",
        "status": "$status",
        "host": "$host",
        "body_bytes_sent": "$body_bytes_sent",
        "request": "$request",
        "remote_user": "$remote_user",
        "client_ip": "$remote_addr",
        "content_length": "$content_length",
        "local_time": "$fmt_ms_time_local",
        "http_referer": "$http_referer",
        "http_x_amz_target": "$http_x_amz_target",
        "http_x_request_id": "$http_x_request_id",
        "upstream_response_time": "$upstream_response_time",
        "upstream_status": "$upstream_status",
        "http_user_agent": "$http_user_agent",
        "request_time": "$request_time",
        "upstream_addr": "$upstream_addr",
        "http_host": "$http_host",
        "content_type": "$content_type"
    }
}'
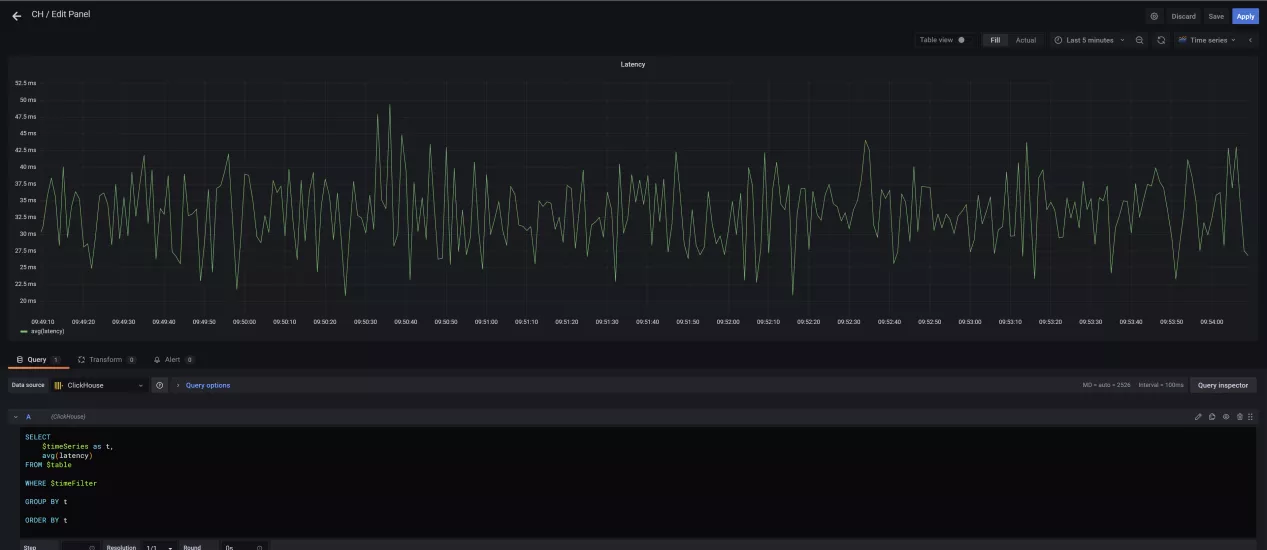
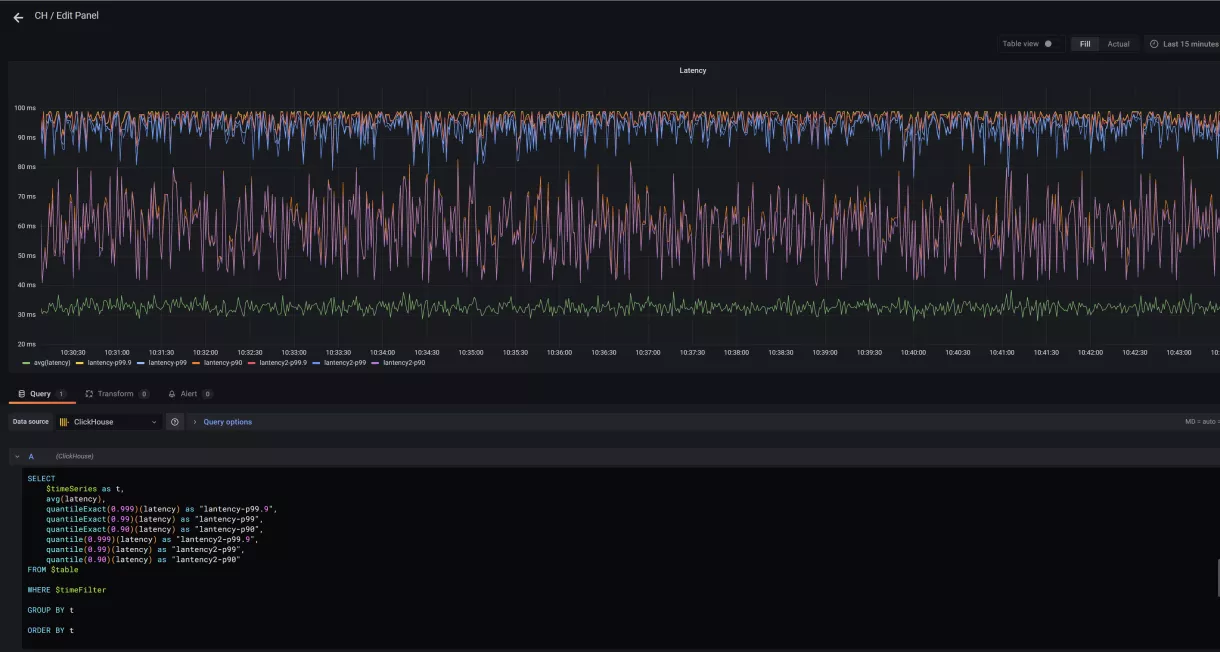
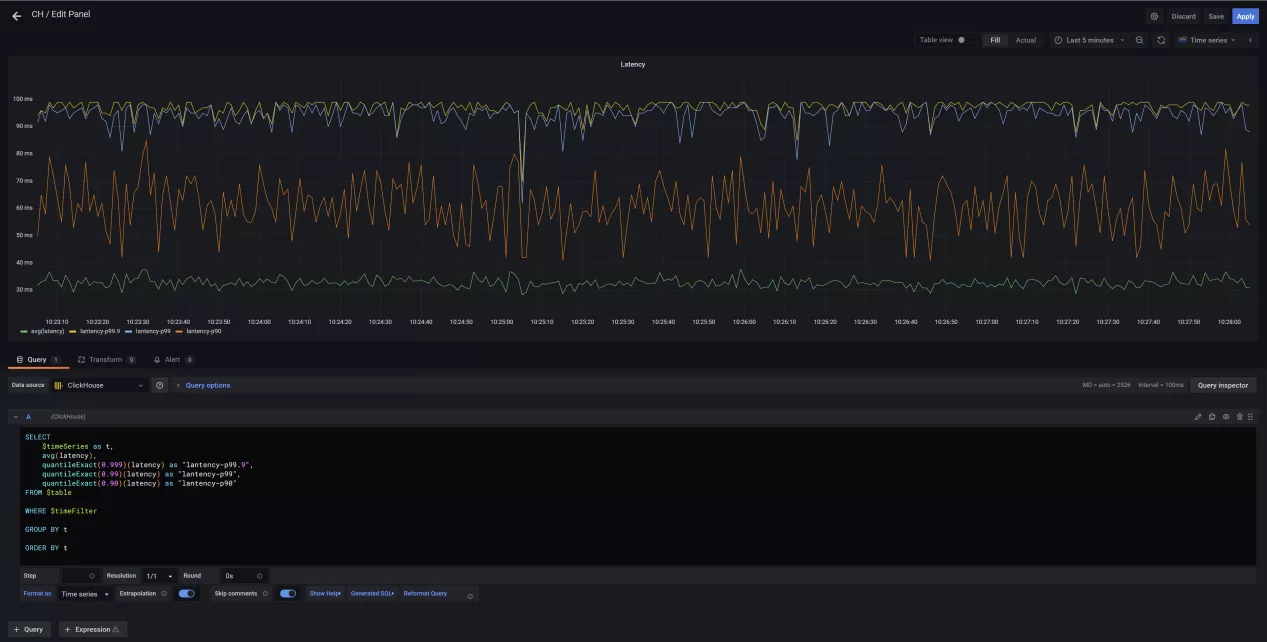
Here are some screenshots of the dashboard after interfacing with Clickhouse using Grafana.


Disable the ClickHouse Plugin
clickhouse-logger can be disabled by removing the appropriate configuration in the plugin configuration. Since the Apache APISIX plugin is hot-loaded, the configuration can be updated without a restart.
curl http://127.0.0.1:9080/apisix/admin/routes/1  \
-H 'X-API-KEY: edd1c9f034335f136f87ad84b625c8f1' -X PUT -d '
{
    "methods": ["GET"],
    "uri": "/hello",
    "plugins": {},
    "upstream": {
        "type": "roundrobin",
        "nodes": {
            "127.0.0.1:1980": 1
        }
    }
}'
Summary
The above is the whole process of developing clickhouse-logger for Apache APISIX, and how to implement it with Grafana to achieve the same observability with simpler architechure and worlflows. I hope more people in the community will be willing to step out of their comfort zones, switching from followers to contributors is much easier than you think.