
Authors: Jiahao Fu, Weichuan Xu, Engineers from the PAAS Department at Honor. This article is based on the presentation given by the two engineers at the APISIX Shenzhen Meetup on April 12, 2025.
About Honor
Established in 2013, Honor is a global leader in smart terminal solutions. Its products are sold in over 100 countries and regions worldwide, with partnerships established with more than 200 operators. Honor operates over 52,000 experience stores and dedicated counters globally, with over 250 million active devices in use.
As a world-class AI terminal ecosystem company, Honor is dedicated to revolutionizing human-machine interaction. Leveraging its diversified innovative product portfolio, including smartphones, personal computers, tablets, and wearable devices, Honor aims to empower every user to effortlessly enter and enjoy the new intelligent world.
Evolution and Architecture of Honor's Gateway
Evolution
Honor began exploring traffic gateway products in 2021, conducting preliminary research on APISIX in Q3, and officially introduced APISIX in Q4 to initiate the construction of its internal traffic gateway platform.
In 2022, APISIX was officially deployed in Honor's production environment. In Q1, pilot promotion of traffic access for consumer-facing (To C) business began; in Q2, APIs were open and available for deployment platforms, supporting traffic scheduling and container instance reporting. Furthermore, even when the deployment platform was not yet fully built, traffic access and scheduling can be performed by invoking APIs through scripts.
In 2023, Q1 saw the completion of APISIX-CP containerization, followed by the launch of APISIX-DP elastic scaling in Q3. By Q4, a single cluster supported over ten million connections, and by year-end, full coverage of cloud services for To C business was achieved.
In 2024, APISIX-DP containerization was completed in Q1, the runtime architecture was optimized to version 2.0 in Q2, and in Q4, Honor reached a throughput of 1 million QPS (queries per second) in a single cluster. By year-end, Honor's API gateway, built on Apache APISIX, supported all of Honor's business projects.
To date, the APISIX-based gateway platform within Honor has achieved peak traffic volumes of millions of QPS. Leveraging APISIX's extensibility, nearly 100 custom plugins have been developed.
Moving forward, Honor's technical team will explore the integration of AI with gateways and investigate how to enable automatic service reporting of gateways to Kubernetes.
Honor Gateway Architecture
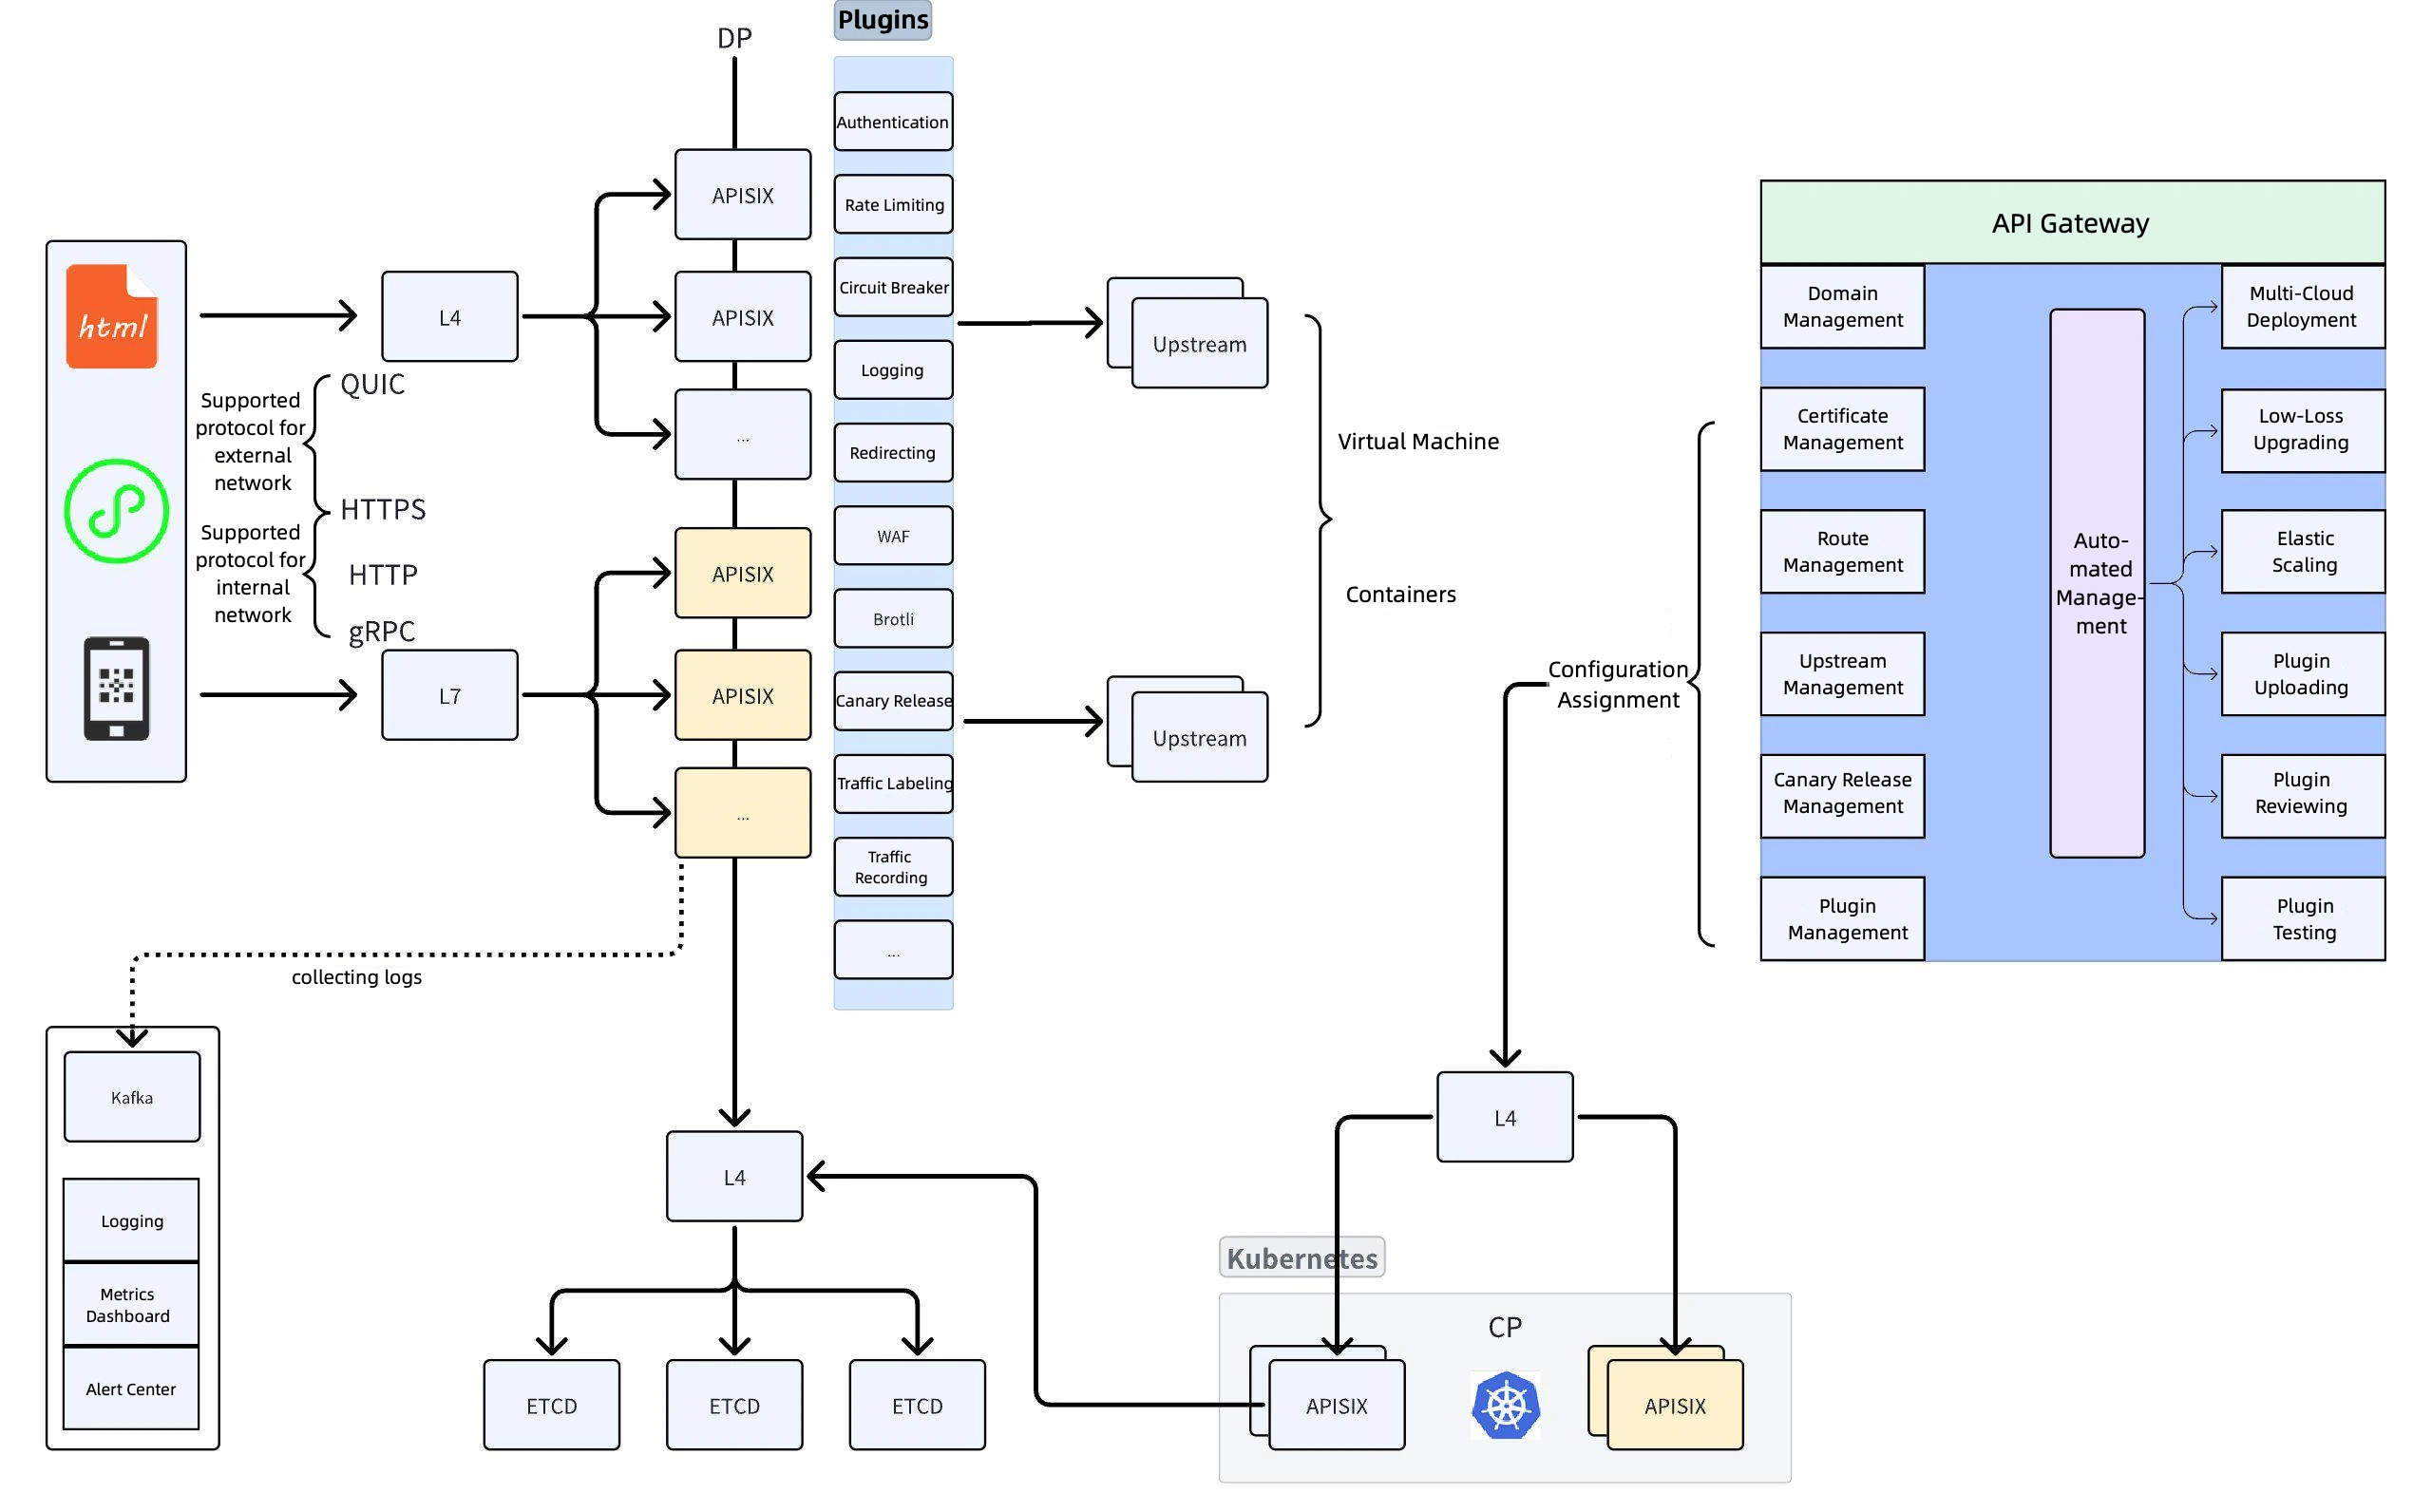
Gateway Architecture
Protocols Supported for Internal and External Networks
Honor's gateway architecture is divided into internal and external network access:
a. Protocols supported for external network: QUIC and HTTPS.
b. Protocols supported for internal network: HTTP, HTTPS, and gRPC. Among these, gRPC primarily handles AI-related traffic, with its QPS showing significant growth over the past year.
Load Balancer and Proxy Selection
a. A load balancer (LB) is deployed in front of APISIX to connect with both layer 4 and layer 7 traffic in the public clouds.
b. Layer 4 proxy: Initially used to publish all routes, but due to business launch issues that layer 4 proxy could not resolve, the setup was switched to layer 7 proxy.
API Clusters and Plugin Marketplace
a. API clusters: Multiple clusters share an etcd instance.
b. Plugin marketplace: Lists common plugins such as authentication, rate limiting, WAF, and traffic labeling.
c. Upstream deployment: Primarily based on containers, with a small number of virtual machines. Containers are connected to the deployment platform, which calls APIs to report traffic and instance information after container deployment.
Log Collection and Analysis
The Prometheus plugin is not used. Instead, logs are collected via Kafka and combined with Elastic Stack for metric analysis and alerting.
etcd Load Balancing Optimization
An additional layer of LB is added in front of etcd to address load imbalance issues when directly connecting to etcd nodes (e.g., excessively high node connection counts).
Gateway Features
User Workflow Management: Covers domain management, certificate management, route registration, and canary release.
Plugin Management: Users upload plugins via the plugin marketplace, and the gateway platform conducts reviews and deployments.
Intelligent Deployment: Shields underlying cloud differences, supporting automated deployment and public cloud adaptation.
Low-Loss Upgrades
Frequent plugin changes during regular operations raise concerns about downtime. By detaching APISIX nodes via LB to ensure all traffic is fully offline before upgrading, automated low-loss upgrades is achieved.
Elastic Scaling
To handle high-traffic scenarios, the gateway can be rapidly scaled out and promptly recovered via virtual machines, supporting automatic scaling. For example, when CPU usage exceeds a threshold, machines are automatically scaled out and attached to the load balancer.
Plugin Deployment and Automation
Plugin Deployment: The management plane is connected to the runtime plane, with configurations pushed to CP for containerized deployment.
CP and DP Isolation: CP and DP connect to the etcd cluster, achieving isolation between the management and runtime planes.
Gateway Practice in Honor's Massive Business
Initially, we utilized APISIX's native plugins. As business grew and requirements evolved, native plugins became insufficient. Consequently, we expanded plugins based on the platform or user-specific needs, resulting in over 100 plugins to date.
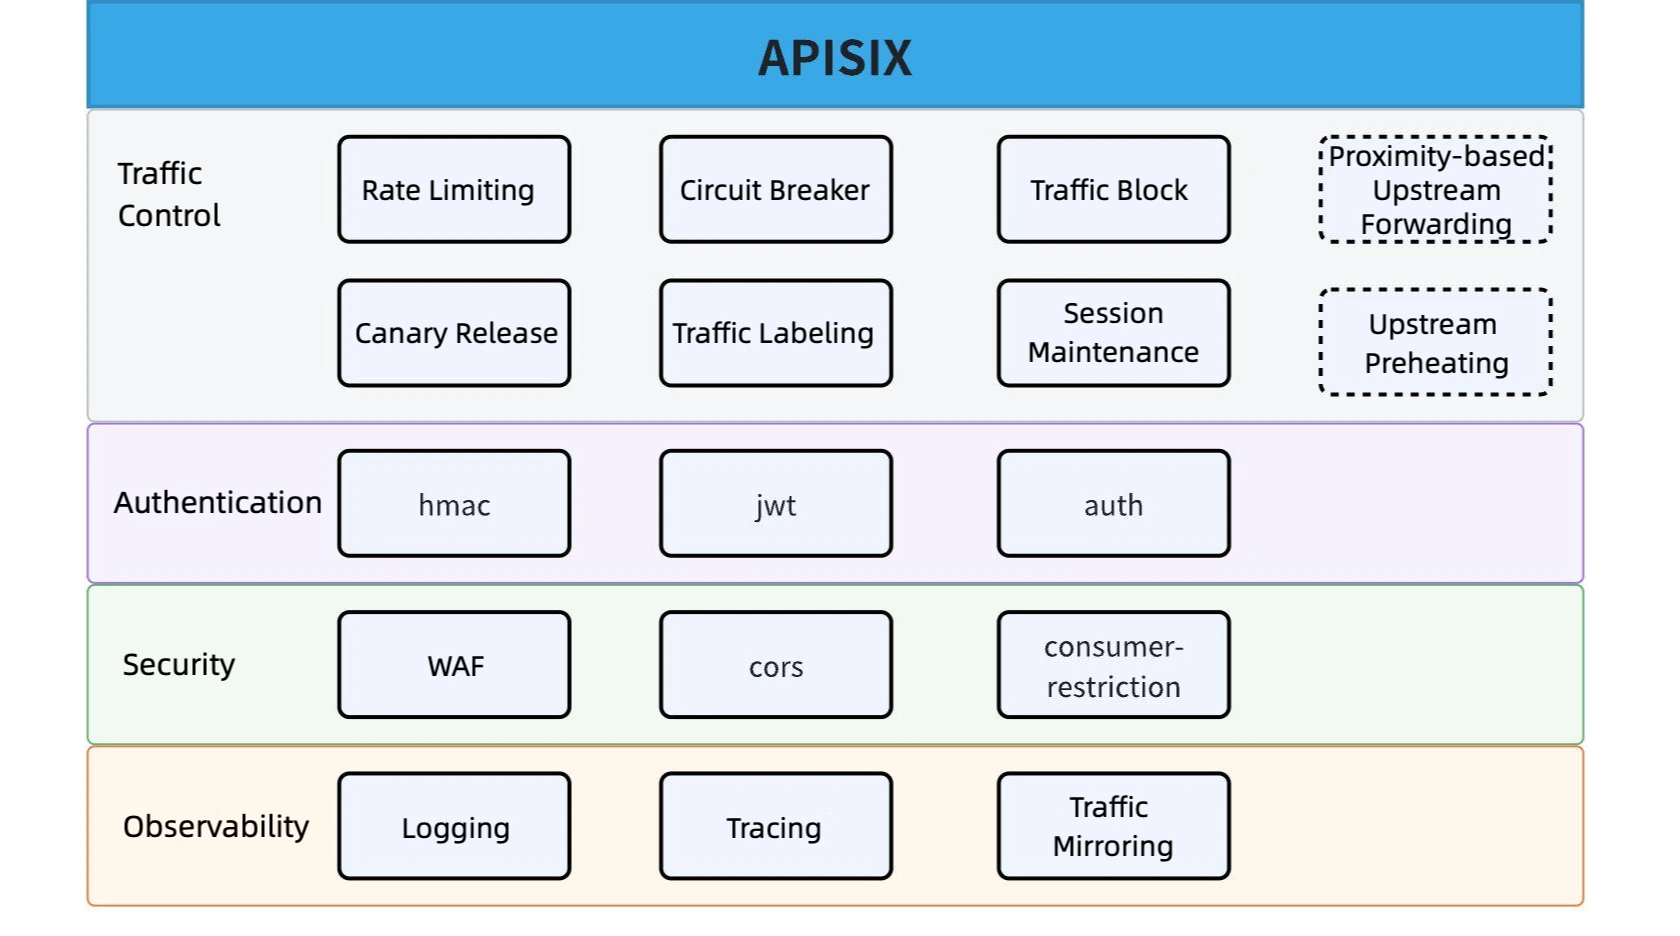
Plugins are categorized into four groups: traffic control, authentication, security, and observability. Since our clusters are predominantly deployed across dual Availability Zones (AZs) to ensure reliability, this setup introduces cross-AZ latency issues. To address this, the gateway facilitates local routing within the same AZ, ensuring traffic is forwarded to the nearest node.
1. Observability: Traffic Mirroring
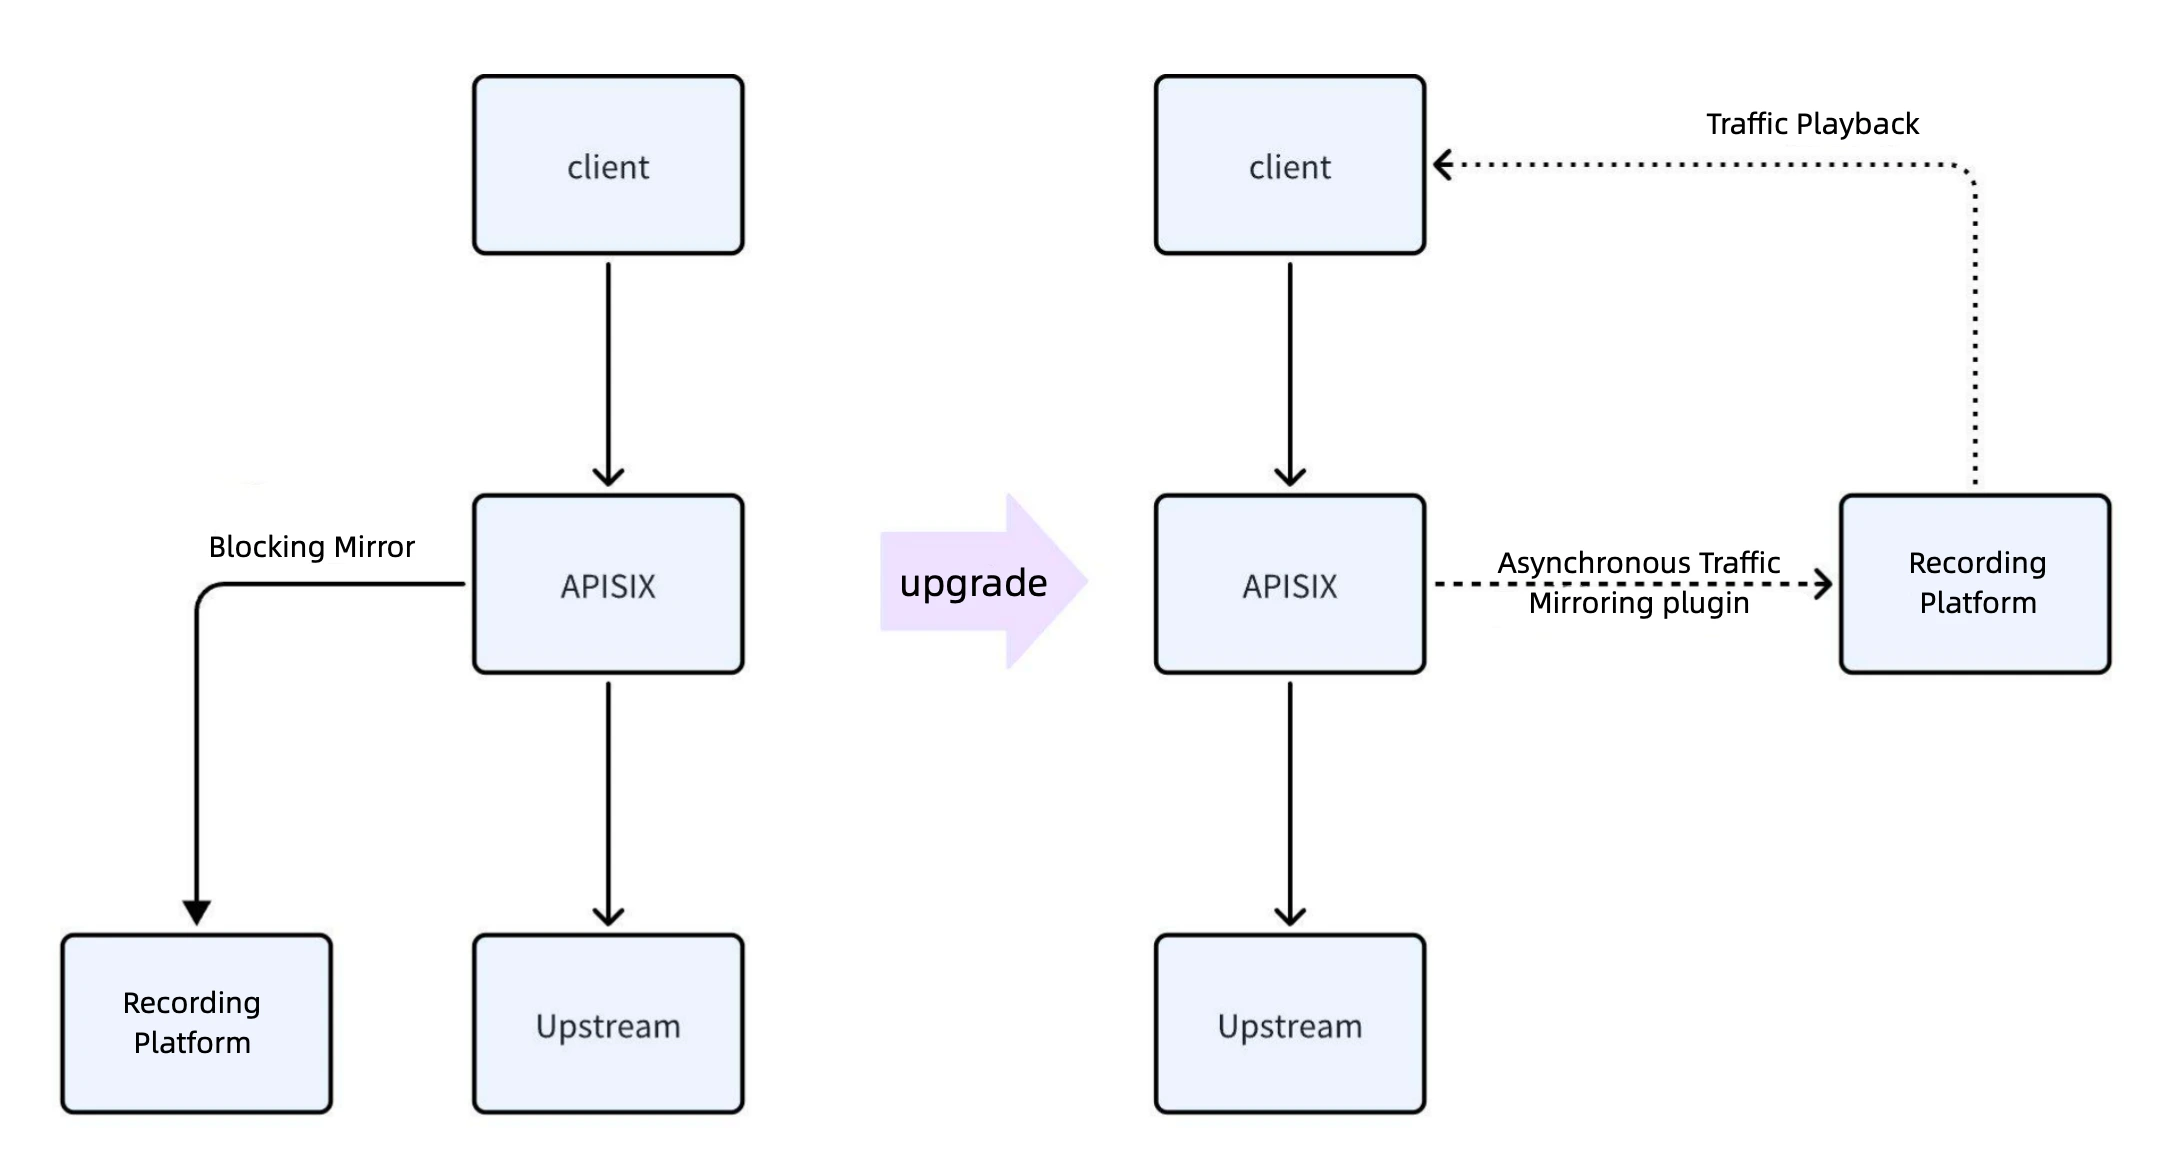
Request Processing and Traffic Mirroring
After a request reaches APISIX, the traffic is forwarded to the upstream service. During this process, the request is mirrored to a third-party asset platform. However, this mirroring operation is blocking, meaning that if the recording platform does not return a response, the client's request is blocked. If the recording platform experiences a failure, it can severely impact the stability of production traffic. Therefore, instead of using the built-in mirroring features of NGINX or APISIX, we implemented asynchronous processing through a custom plugin.
Asynchronous Traffic Processing via Custom Plugin
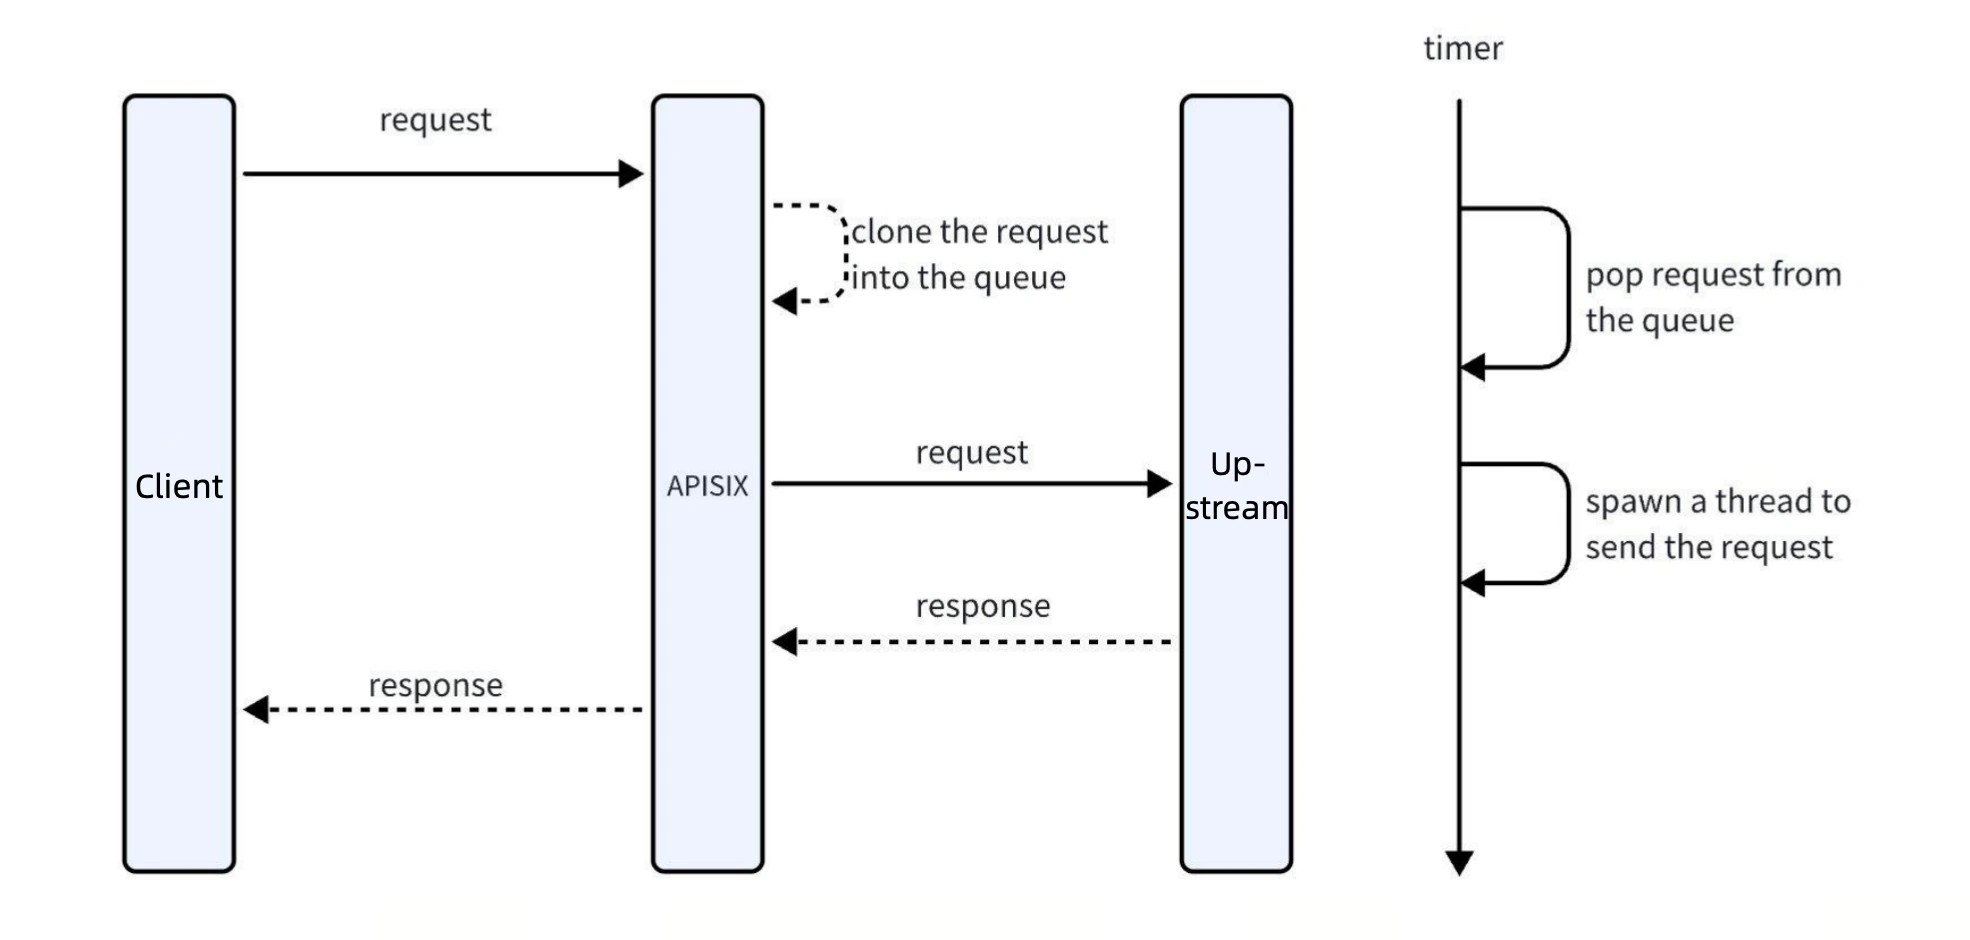
When a request arrives: The request is asynchronously saved to a queue.
Upstream processing: APISIX forwards the request to the upstream server. Once the upstream response is returned, the client request process concludes.
Asynchronous recording: Asynchronous threads extract requests from the queue and send them to the analytics platform for data recording. Since recording requests include timestamps, asynchronous operations do not affect production traffic.
Recording Platform Features
The recording platform is responsible for data collection and supports the following functionalities:
Allowing scaling of the traffic up or down during playback.
Adding specific headers to replayed requests, thus facilitating end-to-end stress testing.
Queue and Thread Optimization
To ensure system performance, we support configuring queue sizes and thread performance parameters. Although asynchronous forwarding does not directly impact formal requests, excessive asynchronous traffic can still increase APISIX's CPU load. Therefore, it is recommended to select optimal parameters based on business requirements to balance performance and recording efficiency.
2. Traffic Scheduling: Canary Release Plugin
We have platformized the canary release feature and optimized the canary release plugin.
Optimized Canary Release Plugin
Traditionally, canary release plugins support traffic distribution based on predefined rules or percentage-based allocations. However, percentage-based routing can lead to inconsistent traffic assignments; for instance, the same request might be routed to different environments at different times, potentially impacting stability in 2C scenarios.
To address this, a key-hash plugin is introduced in front of the canary release plugin, combining with the canary release plugin to achieve stable traffic percentage allocation. The specific implementation is as follows:
Supports hash calculation based on specific request headers or Cookies.
Uses the hash result as input for the canary release plugin to determine traffic allocation percentages.
This ensures consistent and stable traffic allocation, meeting the business requirements of To C scenarios.
Transformed End-to-End Canary Release Plugin
In the end-to-end canary release scenario, we have transformed the canary release plugin to achieve precise traffic scheduling. As shown in the diagram below, Service A is in a canary state, while Services B and C are in the production environment. To maintain the current traffic flow from Service A to B while directing the traffic of Service C to the canary environment, this goal is achieved through an API gateway. The specific implementation is as follows:
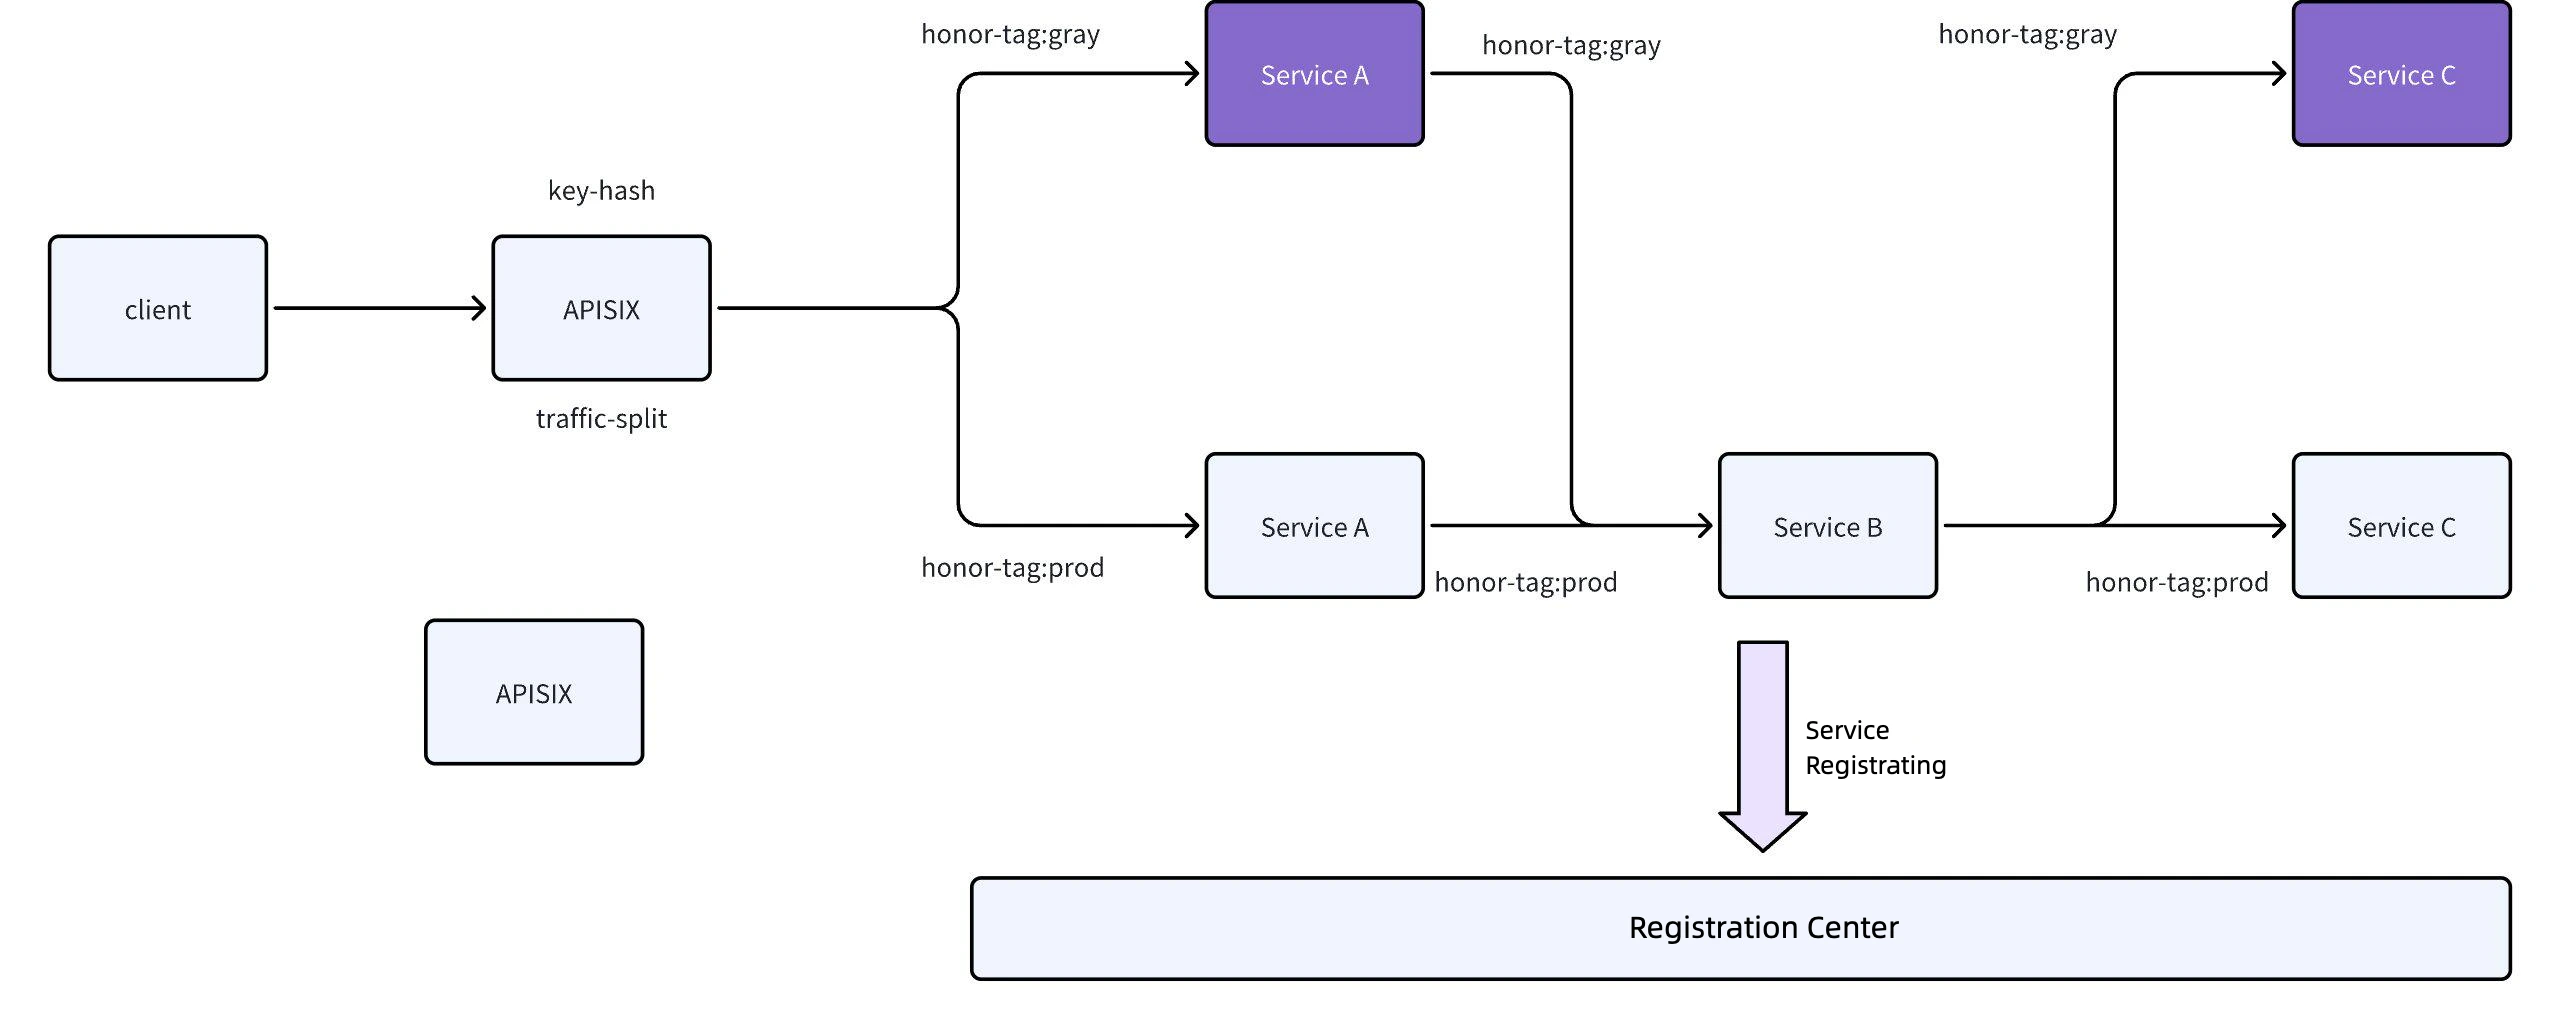
Tag Traffic and Insert Request Header
a. When traffic passes through the APISIX API gateway, it is tagged based on canary release policies.
b. If the traffic is canary traffic, the gateway inserts a specific request header (e.g., honor-tag:gray) into the request to indicate it as canary traffic.
Register and Tag Service
a. When Service A registers with the registration center, it also registers its canary tag (e.g., gray).
b. The registration center maintains the mapping between service canary tags and instances.
Service-to-Service Scheduling
a. Service A calling Service B:
i. After receiving a request, Service A first checks if the request contains a canary tag (e.g., honor-tag:gray).

ii. If the request includes a canary tag, Service A retrieves Service B's canary instances from the registration center based on the tag and prioritizes scheduling to canary instances.

iii. If Service B has no canary instances, it falls back to scheduling production instances.b. Service B calling Service C:
i. After receiving the canary tag (e.g., honor-tag:gray) passed from Service A, Service B retrieves Service C's canary instances from the registration center based on the tag.

ii. If Service C has canary instances, the request is scheduled to the canary instance; otherwise, it is scheduled to a production instance.End-to-End Canary Release
a. Through the transparent transmission of request headers (e.g., honor-tag:gray), the canary tag remains consistent throughout the service chain.
b. Each node in the service chain makes scheduling decisions based on the canary tag, enabling end-to-end canary release.
Through these transformations, we have achieved precise traffic scheduling for end-to-end canary releases, ensuring consistency and stability of canary traffic across the entire service chain.
3. Rate Limiting and Security
APISIX offers rich plugins covering single-node rate limiting and distributed rate limiting solutions. Below are optimization practices for the single-node rate-limiting solution.
3.1 Rate Limiting
Single-Node Rate Limiting
Background and Challenges
Initially, when adopting the single-node rate limiting solution, we encountered several challenges.
If users needed to set a global rate limit (e.g., 4,000 QPS), they had to manually coordinate with platform administrators to confirm the number of gateway nodes and allocate the rate limit value accordingly (e.g., 2,000 QPS per node for two nodes). This process was cumbersome and error-prone.
In the elastic scaling scenario, when the gateway triggers scaling up or down, there may be a mismatch in the throttling values. For example, the CPU usage reached 80%, triggering an automatic scale-out. Assume each node was initially configured with a 2000 QPS limit; increasing the node count to three would inadvertently raise the total rate limit to 6000 QPS. This could overwhelm backend services, leading to potential system anomalies.
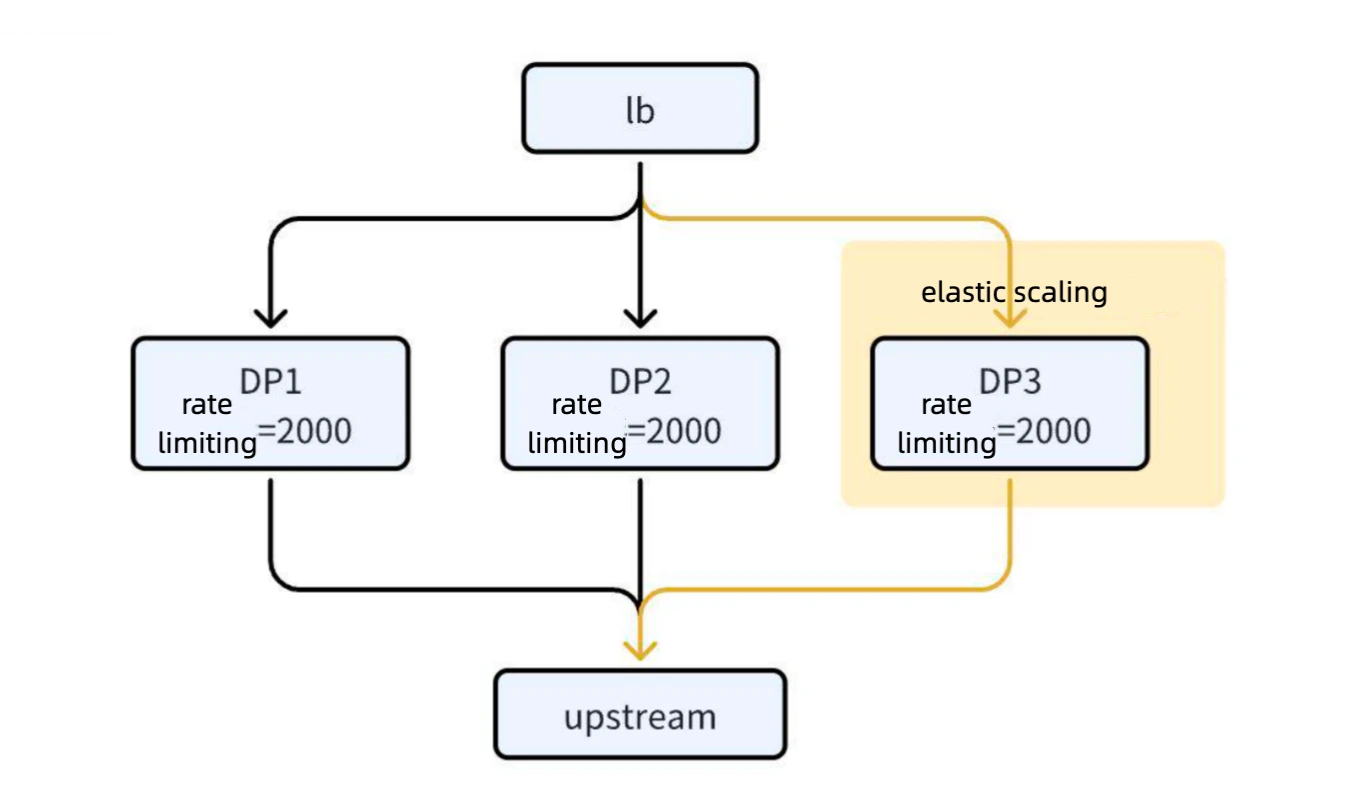
Solution
To address these issues, we implemented the following solutions:
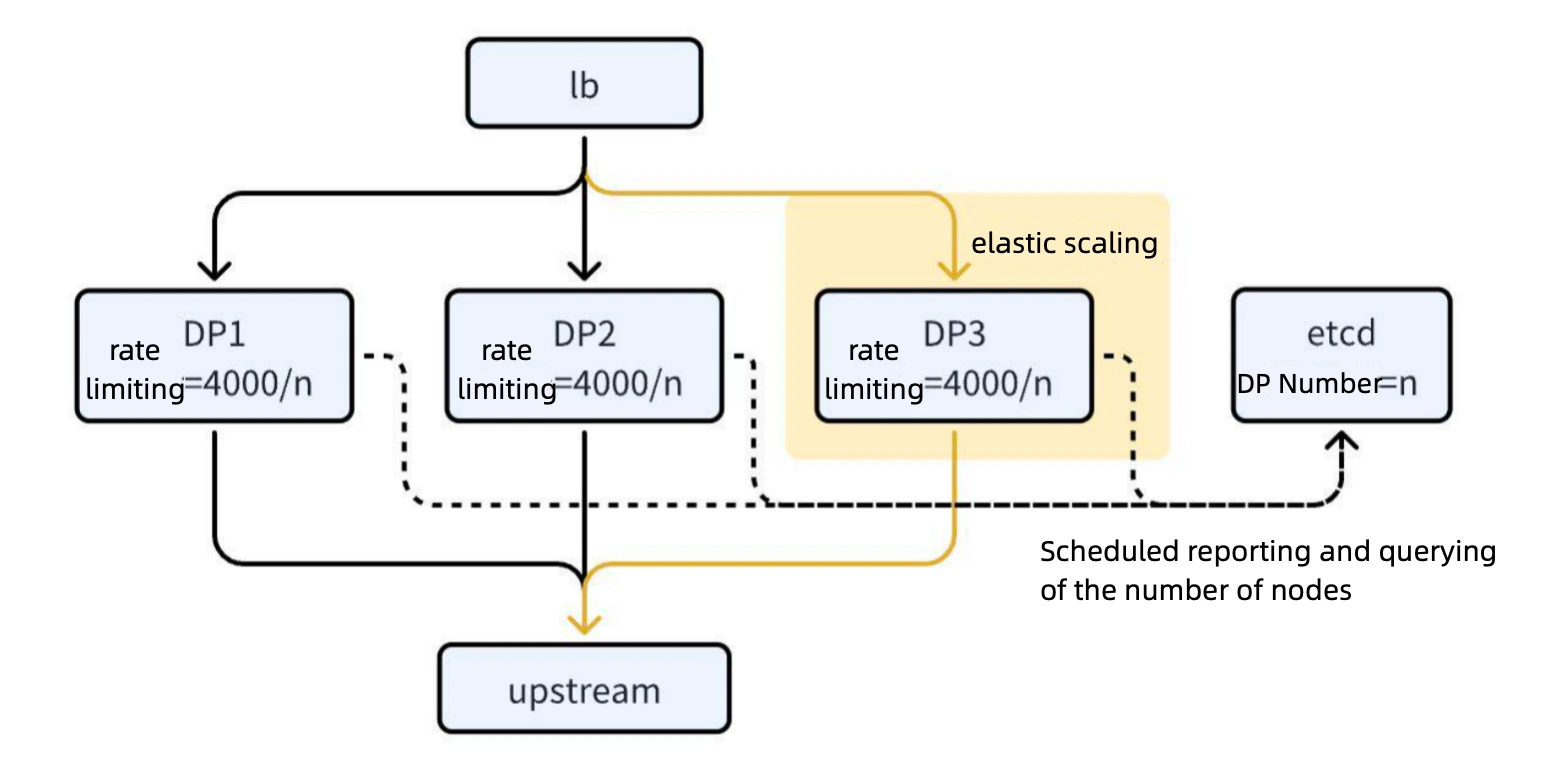
Node Reporting and Maintenance
a. Implementation: Utilizing the
server-infoplugin of APISIX, each DP node's information, such as hostname, is written to etcd as a leased key at regular intervals.b. "Heartbeat Mechanism": By periodically updating (similar to a heartbeat mechanism), etcd consistently maintains all active DP node information in the API gateway.
Dynamic Rate Limiting Calculation
a. Plugin Development: A new plugin periodically retrieves all the node information from etcd to determine the total number of gateway nodes.
b. Excluding CP Nodes: Due to control plane nodes do not handle traffic, only count the number of DP nodes.
c. Dynamic Rate Limit Adjustment: During rate limiting, the plugin dynamically calculates the base rate limit each node should handle, ensuring the rate limit aligns with the actual number of nodes.
Performance Optimization
a. Privileged Process Pulling: Only privileged processes are allowed to periodically retrieve gateway information from etcd, reducing etcd load and minimizing APISIX overhead.
b. Shared Memory Mechanism: Privileged processes write retrieved data to shared memory, and other processes periodically query shared memory to obtain node information.
Plugin Abstraction and Reuse
a. Common Plugin Abstraction: The dynamic rate limiting optimization capability is abstracted into a common plugin, providing a unified interface.
b. Plugin Reuse: Many internal plugins (e.g., fixed window rate limiting, custom performance plugins) can query the number of nodes from shared memory and dynamically adjust configurations to meet optimization requirements.
Distributed Rate Limiting
The open-source APISIX community also provides a distributed rate-limiting solution.
Background and Challenges
When applying the open-source distributed rate limiting solution, we encountered the following key issues:
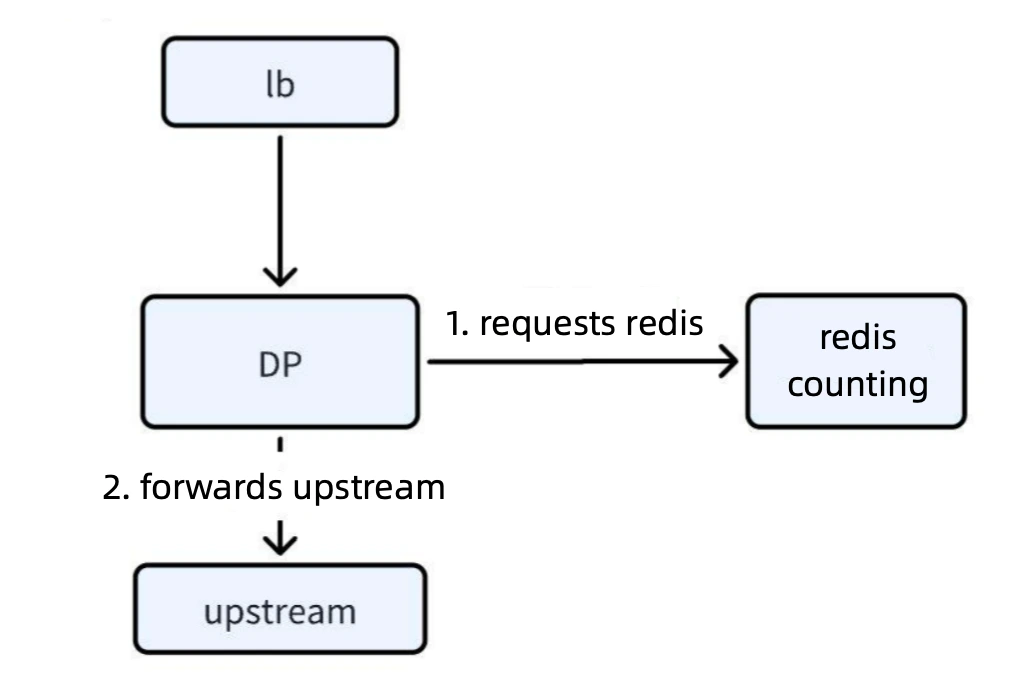
Redis Performance Bottleneck: In scenarios where rate limiting is applied using a single key, particularly when the rate limit rule targets an entire route rather than specific route characteristics, the Redis key becomes overly singular. This leads to all requests being directed to the same Redis shard, preventing effective load balancing through horizontal scaling.
Network Performance Overhead: Frequent Redis requests result in a significant increase in CPU usage, with utilization rising by over 50%.
Increased Request Latency: Open-source distributed rate limiting solutions typically require accessing Redis to complete counting before forwarding the request upstream. This process adds 2–3 milliseconds to the latency of business requests.
Solution
To address these issues, we designed the following optimizations:
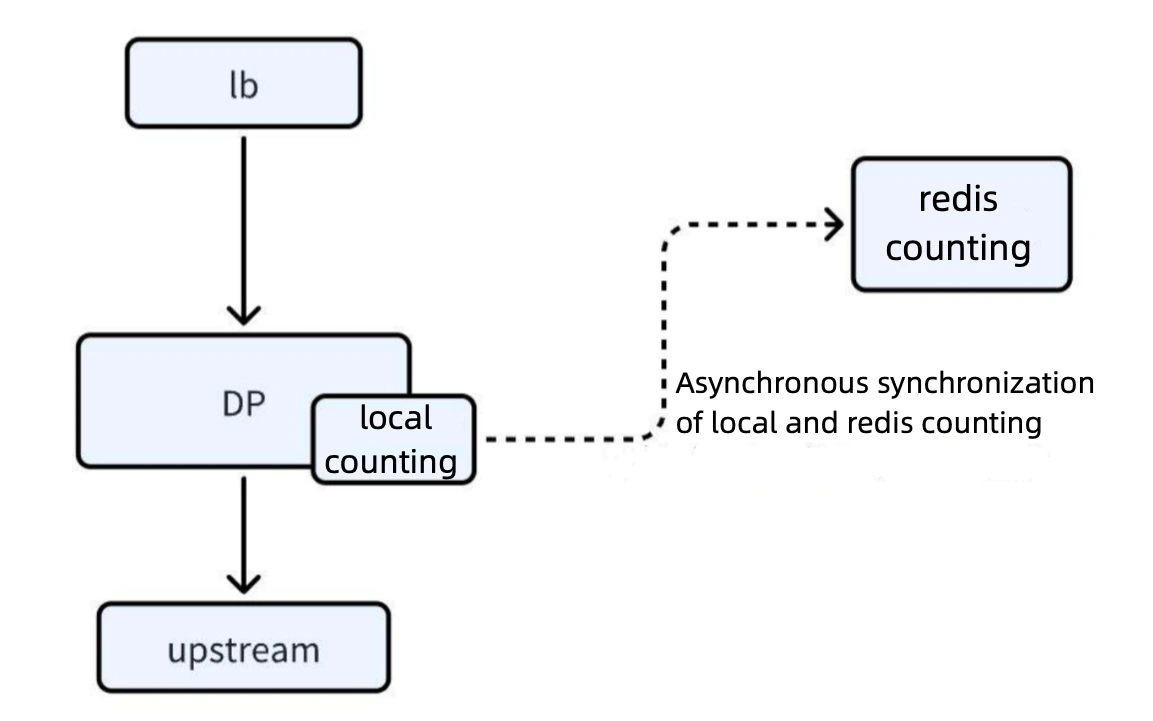
Introducing Local Counting Cache:
a. Local Counting Mechanism: When a request arrives, a count is first deducted from the local counting cache. If the count does not reach zero, the request is allowed to proceed.
b. Asynchronous Synchronization Mechanism: The local count is periodically synchronized with Redis asynchronously. The number of requests between two synchronization periods is counted and deducted from Redis. After synchronization, the Redis count overrides the local cache, ensuring consistency in distributed rate limiting.
Error Control: By applying reasonable formulas and parameter configurations, the error rate is controlled within 3–4%, ensuring rate limiting accuracy meets business requirements.
Applicable Scenarios
High QPS Applications: This solution is suitable for high QPS applications, significantly reducing Redis performance bottlenecks and network overhead.
Low QPS Applications: For low QPS applications (e.g., a few hundred QPS), the existing distributed rate limiting solution generally meets requirements without additional optimization.
3.2 High-Reliable Circuit Breaker Plugin
Background and Challenges
Although the open-source community provides a circuit breaker plugin, evaluation revealed it does not meet internal requirements in two aspects:
Lack of Failure Rate Support: The open-source circuit breaker plugin strategy does not support circuit breaking based on failure rates.
State Transition: The circuit breaker plugin has only on/off states, which may allow a large number of requests to pass during state transitions, exacerbating upstream service degradation and potentially collapsing the gateway due to upstream response timeouts.
Custom Circuit Breaker Plugin
To address these issues, Honor developed a new circuit breaker plugin based on APISIX. Its design features include:
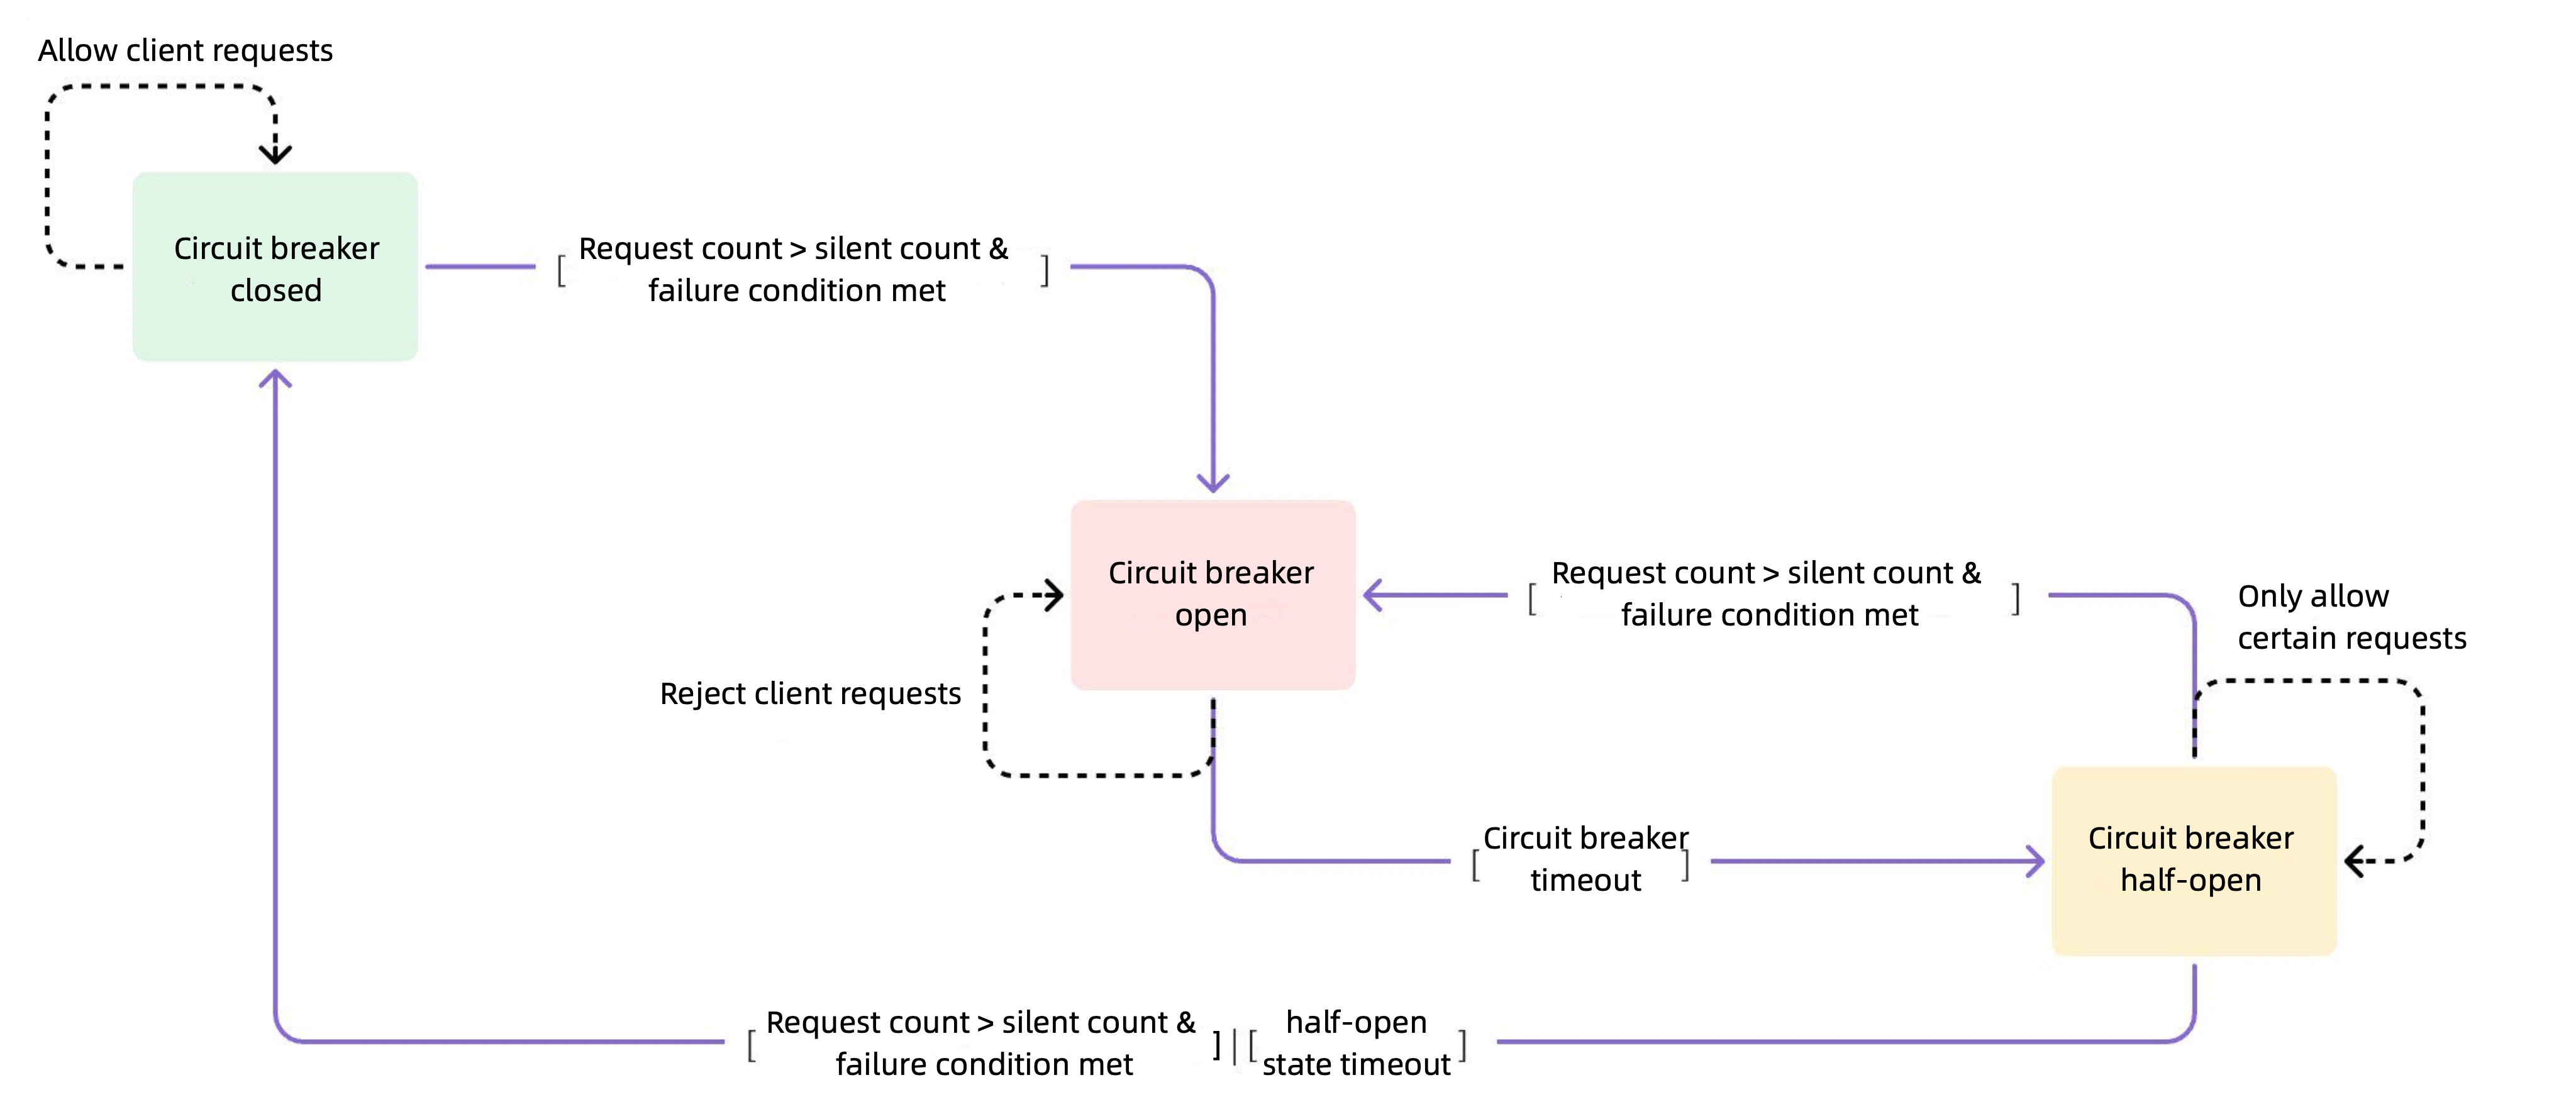
Percentage-Based Circuit Breaking Strategy: Supports circuit breaking based on percentages, offering finer control.
Three-State Control Mechanism:
a. Closed State: All requests are allowed to pass.
b. Open State: All requests are rejected until the circuit breaker time expires.
c. Half-Open State: A limited number of requests are allowed to pass to assess whether upstream services have recovered.
Silent Count Mechanism: The concept of a silent count is introduced to prevent state transitions triggered by a small number of requests. Only when the request count reaches the silent count and the failure rate exceeds the threshold does the state transition to open.
State Transition Process
Closed to Open: When the request count reaches the silent count and the failure rate exceeds the threshold, the circuit breaker transitions to the open state.
Open to Half-Open: After the circuit break time expires, the state transitions to half-open.
Half-Open to Closed: In the half-open state, if the number of allowed requests reaches the configured value and upstream services recover, the state transitions to closed; if the failure rate remains high or there is no response, it reverts to the open state.
Design Updates Based on Sentinel
Window Mechanism: Unlike Sentinel's sliding window, we adopted a fixed window focused on failure rates within a time period, simplifying implementation and reducing performance overhead.
Architecture Adaptation: To accommodate NGINX's multi-process architecture, shared memory was introduced to store state, ensuring consistent behavior across workers and avoiding the complexity and performance costs associated with sliding windows.
3.3 Enhance Reliability with Bypass WAF
Limitations of Inline WAF
As shown in the left architecture diagram, traditional WAFs require modifying DNS records to route traffic to the WAF. After inspecting and filtering the traffic, WAFs forward it back to the origin server. However, this architecture is prone to single points of failure. If the WAF itself encounters a malfunction, it can disrupt the entire traffic flow, adversely affecting business operations.
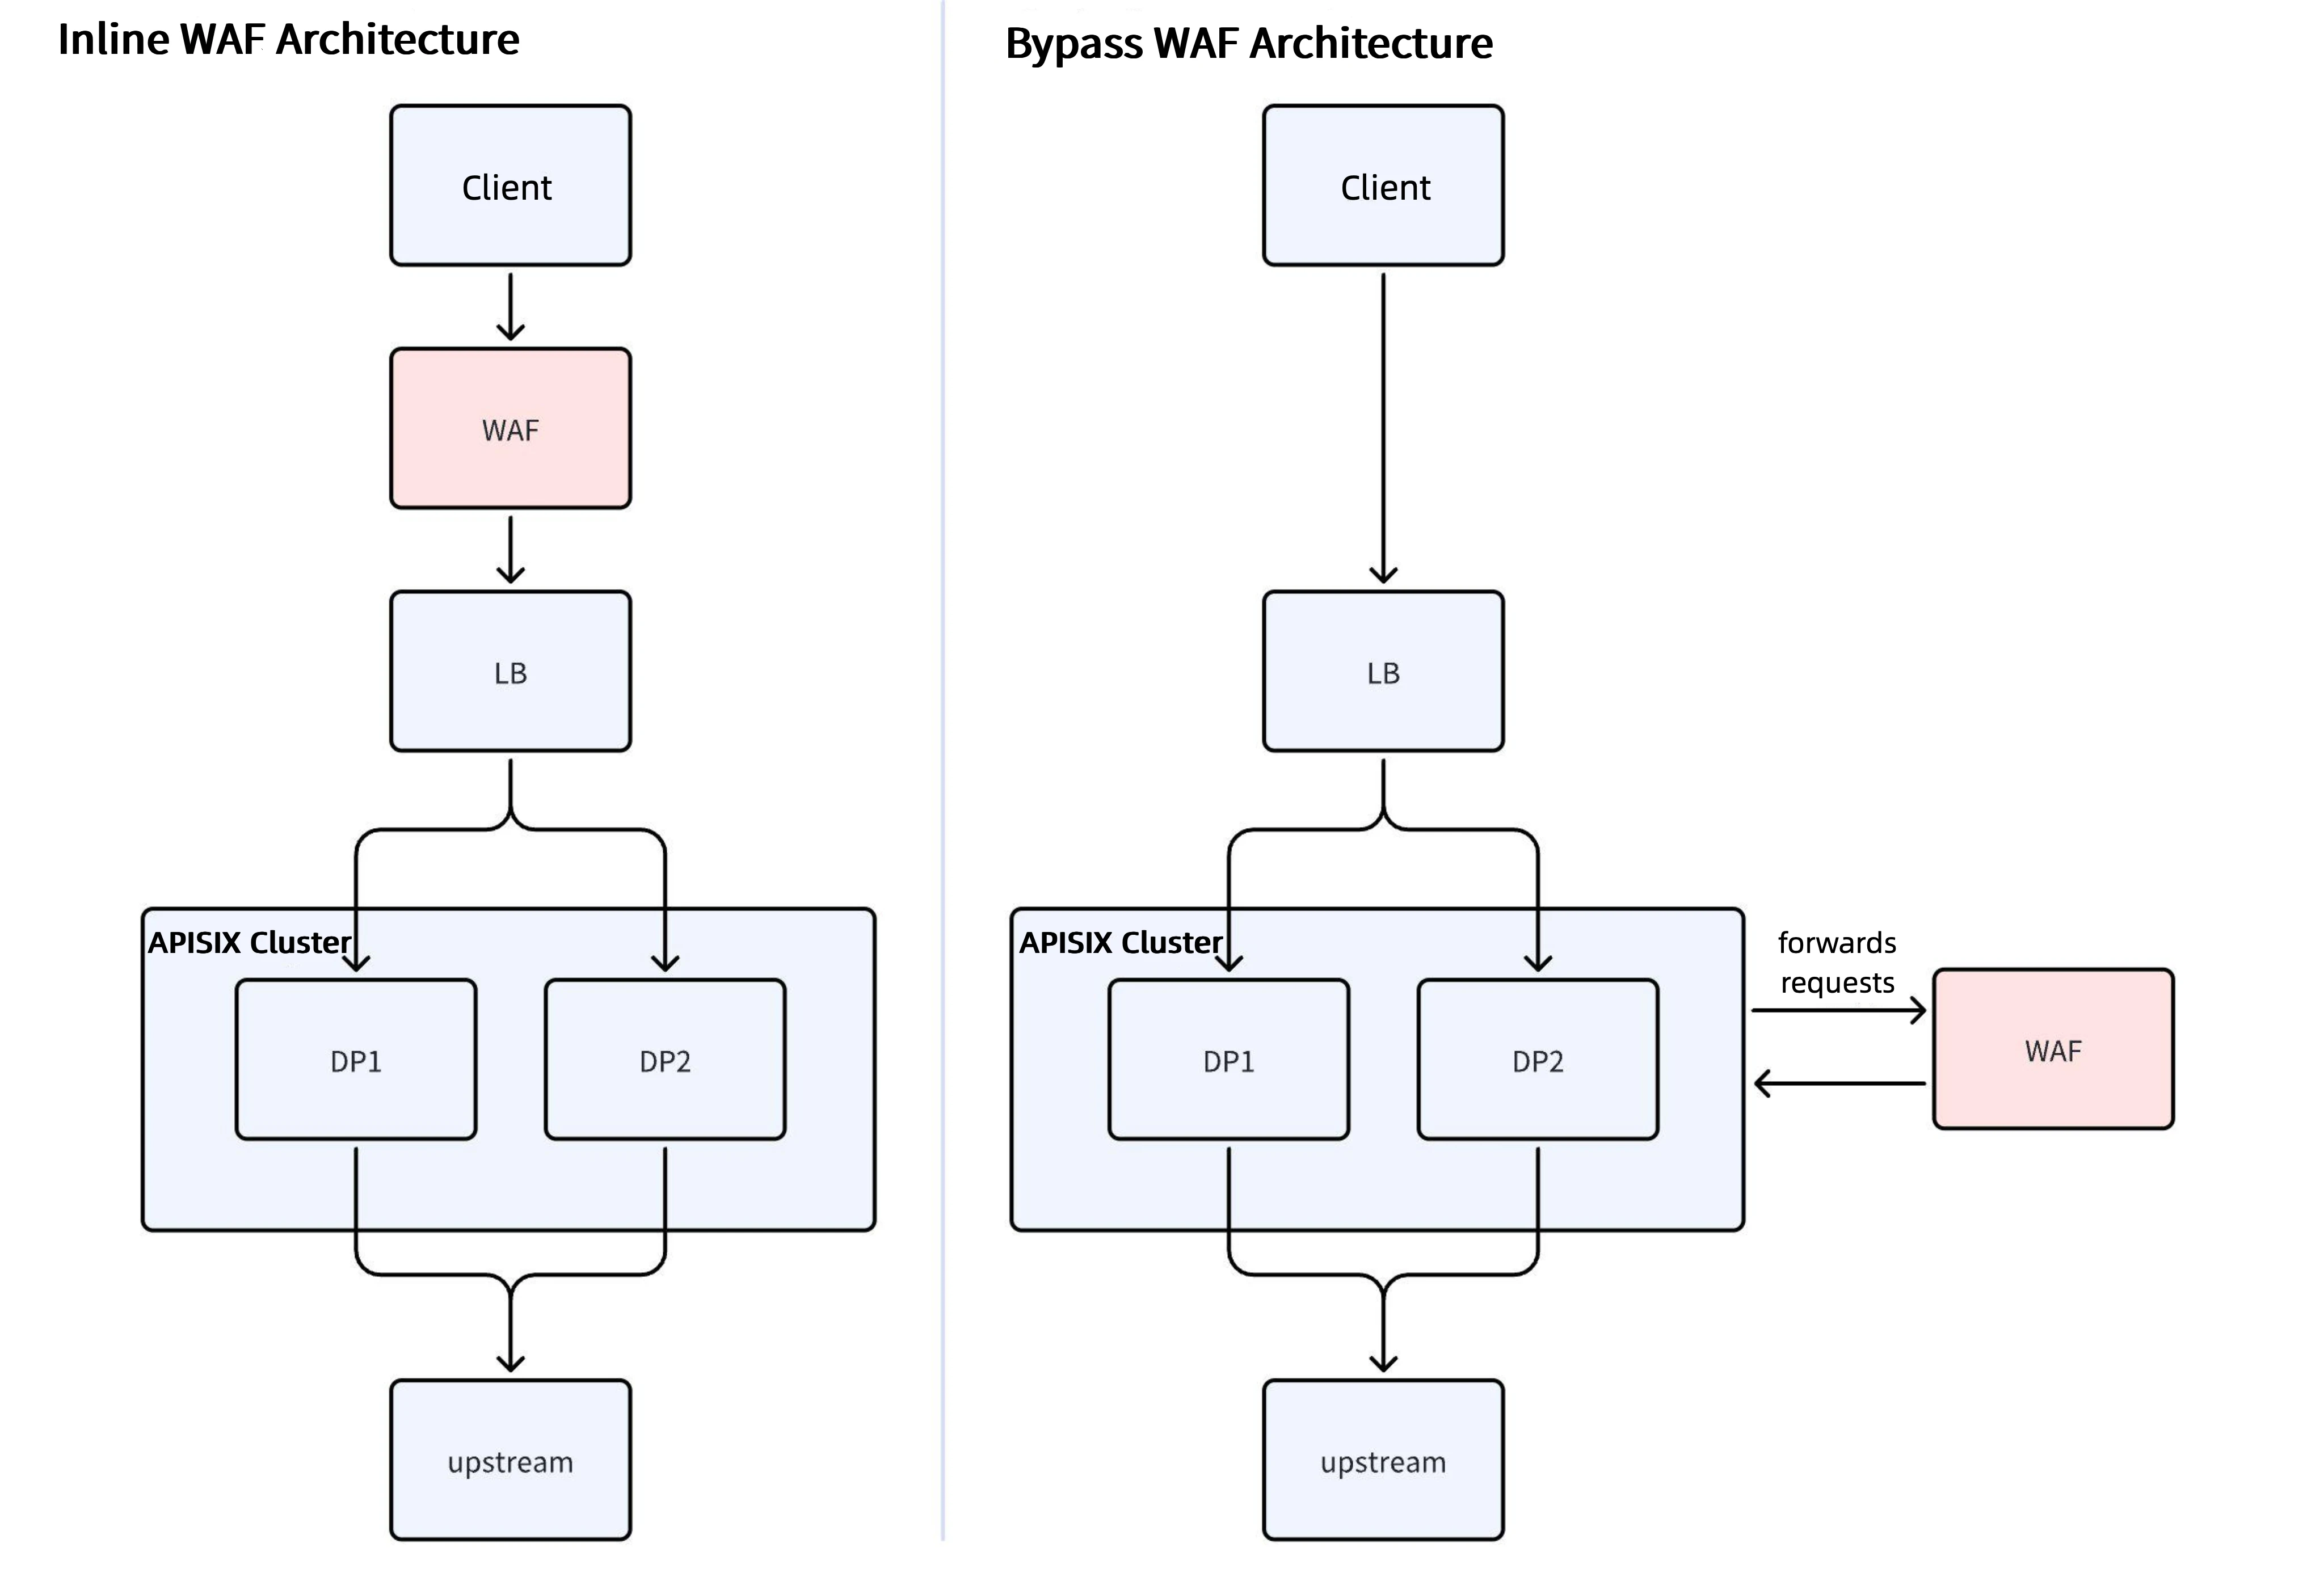
Bypass WAF
To resolve this issue, Honor, in collaboration with API7.ai and Tencent Cloud, implemented a bypass WAF architecture:
Optimized Traffic Path: Traffic no longer needs to pass through the WAF; instead, it is directed straight to the APISIX cluster.
Traffic Splitting for Detection: Within the APISIX cluster, a portion of the traffic is forwarded to the WAF for inspection to determine whether it is normal or contains malicious attacks (e.g., egress attacks and command egress attacks).
Status Code Response Mechanism:
a. If the WAF detects normal traffic, it returns a
200status code, allowing the request to pass through to the upstream server.b. If the WAF detects malicious attacks, it returns a status code similar to
403, rejecting the request.Fault Tolerance: If the WAF fails, traffic can be directly forwarded to the backend, preventing link interruption due to WAF failure and enhancing overall link reliability.
Performance and Cost Optimization
Performance Optimization
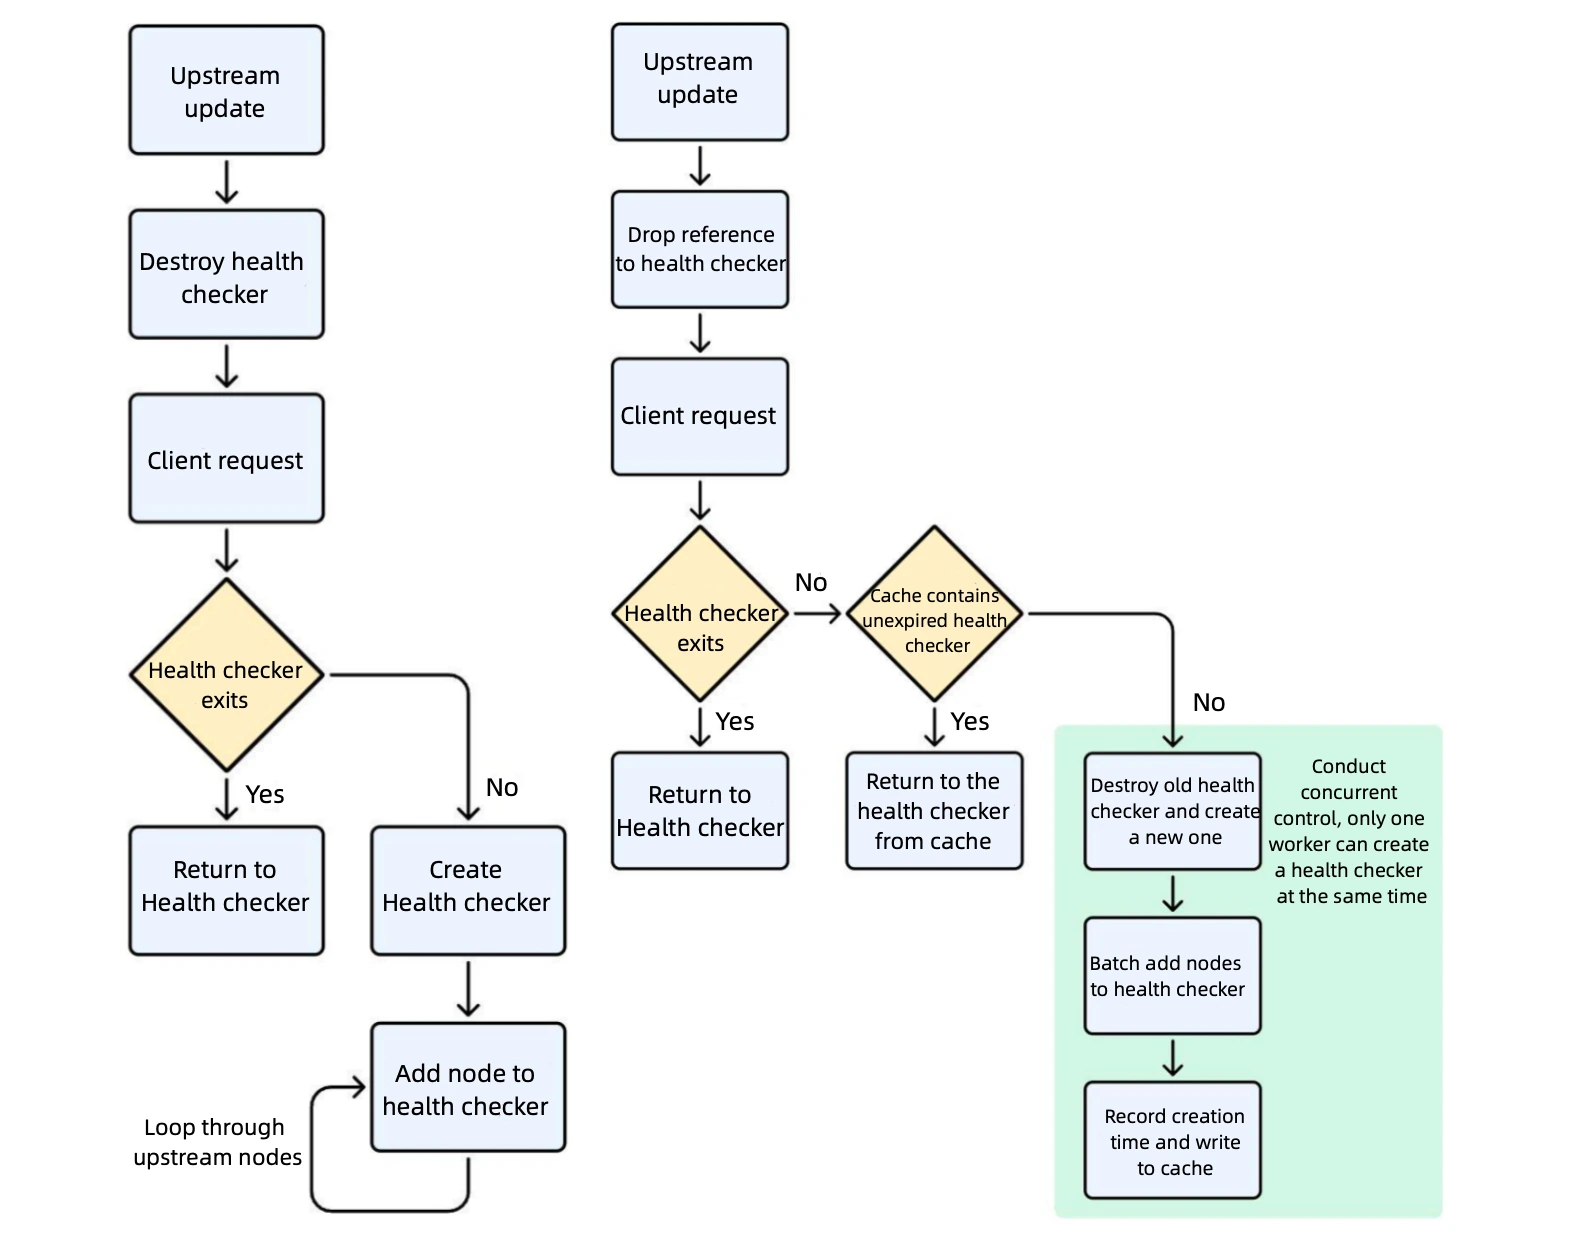
Health Checker Optimization
Background and Challenges
In high-traffic internal business scenarios, with over a thousand upstream nodes, frequent rolling updates triggered the destruction and creation of health checkers. This led to significant CPU usage spikes.
Upstream Destruction and Creation: Upon upstream updates, health checkers were destroyed. Health checkers are only probed when client requests arrive; if they do not exist, they are immediately created.
Node-by-Node Addition: During creation, all nodes had to be traversed and individually added to the health checker's shared memory. This process involved extensive locking operations and memory writes, resulting in significant performance degradation.
Solutions
Delayed Destruction: During upstream updates, health checkers are temporarily not destroyed but merely lose their references, reducing performance overhead from frequent destruction and creation.
Caching Mechanism: When creating health checkers, they are cached with their creation time recorded. Subsequent requests first check if the health checker exists. If not, the cache is replenished. If not expired, it is directly returned; if expired, it is recreated.
Batch Updates: All upstream nodes are batch-updated to the health checker's shared memory, reducing the overhead of node-by-node operations.
Concurrency Control: A concurrency control mechanism is introduced to ensure only one worker is responsible for creating health checkers at any given time, preventing multiple workers from performing the same operation simultaneously and significantly reducing CPU consumption.
Results
In scenarios involving frequent updates of 2,000 upstream nodes, the optimized approach resulted in only a ~2% increase in CPU usage, a substantial improvement compared to the previous 20% increase. This demonstrates a significant reduction in performance overhead and highlights the effectiveness of the optimization.
Cost Optimization
Cost optimization primarily focuses on three aspects: traffic compression, static single-line EIP transformation, and gateway scaling.
Traffic Compression
Background
Through statistics on gateway costs, approximately three-quarters of the total cost is attributed to traffic costs. Therefore, our optimization efforts first target traffic reduction.
Solutions
Honor provides compression plugins such as br and gzip, supporting dynamic compression. These plugins are user-friendly; businesses only need to include a compression identifier in the request, and clients and browsers typically support decompression.
Results
In cloud providers' LB billing models, traffic volume is the primary billing factor. By using compression plugins, LB costs and EIP bandwidth costs can be reduced, with a maximum compression rate exceeding 70%, significantly lowering traffic costs.
Static Single-Line EIP Transformation
Background
BGP EIP bandwidth costs are prohibitively high.
Solutions
Configure a static single-line EIP for gateway clusters, supplemented by a backup BGP EIP.
Use DNS intelligent resolution to direct mainstream carrier routes to corresponding single-line EIPs.
Results
Single-line EIP costs are one-third of BGP EIP costs, saving approximately two-thirds of public network bandwidth expenses.
Gateway Scaling
Optimization
Implement elastic gateway scaling based on CPU and memory utilization.
Results
Ensure resource utilization remains within a reasonable range to avoid resource waste or insufficiency.
Summary
Since adopting APISIX in 2021, Honor has developed a high-performance, scalable, and reliable API gateway to support the rapid growth of its extensive business through continuous optimization and expansion. The following are the achievements of Honor using Apache APISIX:
Traffic Handling: Honor's API gateway has evolved from pilot deployments to comprehensive coverage, handling peak traffic volumes reaching millions of QPS.
Plugins: To meet diverse business requirements, Honor has developed nearly 100 custom plugins.
Architecture Stability and Scalability: Through optimizations such as internal and external network protocol supports, load balancer upgrades, and plugin marketplace development, the platform's stability and scalability have been enhanced.
Features: optimizations such as canary releases, rate limiting, circuit breaking, and bypass WAF architecture ensure precise traffic scheduling and enhance reliability.
Performance: Health checker optimizations and concurrency control significantly lower CPU usage.
Cost: Strategies like traffic compression, EIP transformation, and scaling techniques substantially reduce expenses.
Future Outlook
Moving forward, Honor plans to integrate artificial intelligence into its API gateway platform to enhance intelligent traffic management and decision-making processes. Additionally, through innovative approaches such as containerized auto-reporting mechanisms, Honor aims to help internal teams achieve efficient resource management and business deployment in Kubernetes environments.