Control API
In Apache APISIX, the control API is used to:
- Expose the internal state of APISIX.
- Control the behavior of a single, isolated APISIX data plane.
To change the default endpoint (127.0.0.1:9090) of the Control API server, change the ip and port in the control section in your configuration file (conf/config.yaml):
apisix:
  ...
  enable_control: true
  control:
    ip: "127.0.0.1"
    port: 9090
To enable parameter matching in plugin's control API, add router: 'radixtree_uri_with_parameter' to the control section.
Note: Never configure the control API server to listen to public traffic.
Control API Added via Plugins#
Plugins can be enabled to add its control API.
Some Plugins have their own control APIs. See the documentation of the specific Plugin to learn more.
Plugin Independent Control API#
The supported APIs are listed below.
GET /v1/schema#
Introduced in v2.2.
Returns the JSON schema used by the APISIX instance:
{
    "main": {
        "route": {
            "properties": {...}
        },
        "upstream": {
            "properties": {...}
        },
        ...
    },
    "plugins": {
        "example-plugin": {
            "consumer_schema": {...},
            "metadata_schema": {...},
            "schema": {...},
            "type": ...,
            "priority": 0,
            "version": 0.1
        },
        ...
    },
    "stream-plugins": {
        "mqtt-proxy": {
            ...
        },
        ...
    }
}
Note: Only the enabled plugins are returned and they may lack fields like consumer_schema or type depending on how they were defined.
GET /v1/healthcheck#
Introduced in v2.3.
Returns a health check of the APISIX instance.
[
  {
    "nodes": [
      {
        "ip": "52.86.68.46",
        "counter": {
          "http_failure": 0,
          "success": 0,
          "timeout_failure": 0,
          "tcp_failure": 0
        },
        "port": 80,
        "status": "healthy"
      },
      {
        "ip": "100.24.156.8",
        "counter": {
          "http_failure": 5,
          "success": 0,
          "timeout_failure": 0,
          "tcp_failure": 0
        },
        "port": 80,
        "status": "unhealthy"
      }
    ],
    "name": "/apisix/routes/1",
    "type": "http"
  }
]
Each of the returned objects contain the following fields:
- name: resource id, where the health checker is reporting from.
- type: health check type:
["http", "https", "tcp"]. - nodes: target nodes of the health checker. It is an empty array (
[]) until the health checker registers its targets, which happens the first time the upstream serves a request. - nodes[i].ip: ip address.
- nodes[i].port: port number.
- nodes[i].status: health check result:
["healthy", "unhealthy", "mostly_healthy", "mostly_unhealthy"]. - nodes[i].counter.success: success health check count.
- nodes[i].counter.http_failure: http failures count.
- nodes[i].counter.tcp_failure: tcp connect/read/write failures count.
- nodes[i].counter.timeout_failure: timeout count.
A plugin can run active health checks of its own, on nodes that belong to no upstream. ai-proxy-multi does this: it probes every LLM instance and skips the unhealthy ones when it picks a target. Such a checker is reported with two extra fields:
{
  "name": "/apisix/routes/1#plugins['ai-proxy-multi'].instances[0]",
  "plugin": "ai-proxy-multi",
  "meta": {
    "instance": "openai"
  },
  "type": "http",
  "nodes": [
    {
      "ip": "52.86.68.46",
      "port": 443,
      "status": "healthy",
      "counter": {
        "http_failure": 0,
        "success": 2,
        "timeout_failure": 0,
        "tcp_failure": 0
      }
    }
  ]
}
- plugin: name of the plugin owning the health checker. Absent for an upstream health checker.
- meta: filled by the plugin to describe what the checker stands for. Its content is plugin specific;
ai-proxy-multireports the instance name.
You can also use /v1/healthcheck/$src_type/$src_id to get the health status of specific nodes.
For example, GET /v1/healthcheck/upstreams/1 returns:
{
  "nodes": [
    {
      "ip": "52.86.68.46",
      "counter": {
        "http_failure": 0,
        "success": 2,
        "timeout_failure": 0,
        "tcp_failure": 0
      },
      "port": 80,
      "status": "healthy"
    },
    {
      "ip": "100.24.156.8",
      "counter": {
        "http_failure": 5,
        "success": 0,
        "timeout_failure": 0,
        "tcp_failure": 0
      },
      "port": 80,
      "status": "unhealthy"
    }
  ],
  "type": "http"
  "name": "/apisix/routes/1"
}
note
An upstream is shown in the result list as soon as it is configured with a health
checker. Its nodes stay empty until the upstream has served requests in any
worker process, because the health checker is only created then.
If you use browser to access the control API URL, then you will get the HTML output:
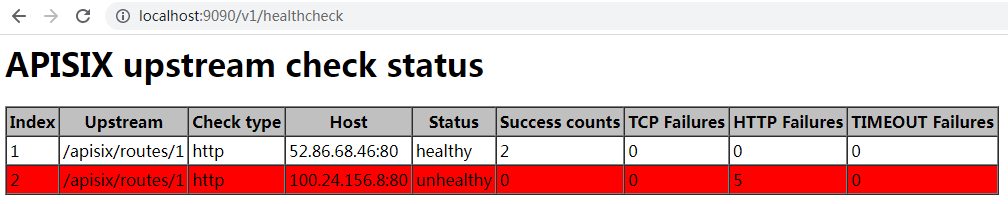
GET /v1/healthcheck/{src_type}/{src_id}/checkers#
Returns every health checker one resource owns, as an array of the entries
described above. A resource can own more than one -- its upstream plus one per
plugin instance -- which GET /v1/healthcheck/$src_type/$src_id cannot express,
since it returns a single object.
For example, GET /v1/healthcheck/routes/1/checkers returns:
[
  {
    "name": "/apisix/routes/1",
    "type": "http",
    "nodes": [...]
  },
  {
    "name": "/apisix/routes/1#plugins['ai-proxy-multi'].instances[0]",
    "plugin": "ai-proxy-multi",
    "meta": {
      "instance": "openai"
    },
    "type": "http",
    "nodes": [...]
  }
]
A resource with no health check at all is not an error here: it owns an empty
set of checkers, and the endpoint returns []. 404 is returned only when the
resource itself does not exist.
POST /v1/gc#
Introduced in v2.8.
Triggers a full garbage collection in the HTTP subsystem.
Note: When stream proxy is enabled, APISIX runs another Lua VM for the stream subsystem. Full garbage collection is not triggered in this VM.
GET /v1/routes#
Introduced in v2.10.0.
Returns all configured Routes:
[
  {
    "value": {
      "priority": 0,
      "uris": [
        "/hello"
      ],
      "id": "1",
      "upstream": {
        "scheme": "http",
        "pass_host": "pass",
        "nodes": [
          {
            "port": 1980,
            "host": "127.0.0.1",
            "weight": 1
          }
        ],
        "type": "roundrobin",
        "hash_on": "vars"
      },
      "status": 1
    },
    "has_domain": false,
    "orig_modifiedIndex": 1631193445,
    "modifiedIndex": 1631193445,
    "key": "/routes/1"
  }
]
GET /v1/route/{route_id}#
Introduced in v2.10.0.
Returns the Route with the specified route_id:
{
  "value": {
    "priority": 0,
    "uris": [
      "/hello"
    ],
    "id": "1",
    "upstream": {
      "scheme": "http",
      "pass_host": "pass",
      "nodes": [
        {
          "port": 1980,
          "host": "127.0.0.1",
          "weight": 1
        }
      ],
      "type": "roundrobin",
      "hash_on": "vars"
    },
    "status": 1
  },
  "has_domain": false,
  "orig_modifiedIndex": 1631193445,
  "modifiedIndex": 1631193445,
  "key": "/routes/1"
}
GET /v1/services#
Introduced in v2.11.0.
Returns all the Services:
[
  {
    "has_domain": false,
    "modifiedIndex": 671,
    "key": "/apisix/services/200",
    "createdIndex": 671,
    "value": {
      "upstream": {
          "scheme": "http",
          "hash_on": "vars",
          "pass_host": "pass",
          "type": "roundrobin",
          "nodes": [
            {
              "port": 1980,
              "weight": 1,
              "host": "127.0.0.1"
            }
          ]
      },
      "create_time": 1634552648,
      "id": "200",
      "plugins": {
        "limit-count": {
          "key": "remote_addr",
          "time_window": 60,
          "redis_timeout": 1000,
          "allow_degradation": false,
          "show_limit_quota_header": true,
          "policy": "local",
          "count": 2,
          "rejected_code": 503
        }
      },
      "update_time": 1634552648
    }
  }
]
GET /v1/service/{service_id}#
Introduced in v2.11.0.
Returns the Service with the specified service_id:
{
  "has_domain": false,
  "modifiedIndex": 728,
  "key": "/apisix/services/5",
  "createdIndex": 728,
  "value": {
    "create_time": 1634554563,
    "id": "5",
    "upstream": {
      "scheme": "http",
      "hash_on": "vars",
      "pass_host": "pass",
      "type": "roundrobin",
      "nodes": [
        {
          "port": 1980,
          "weight": 1,
          "host": "127.0.0.1"
        }
      ]
    },
    "update_time": 1634554563
  }
}
GET /v1/upstreams#
Introduced in v2.11.0.
Dumps all Upstreams:
[
   {
      "value":{
         "scheme":"http",
         "pass_host":"pass",
         "nodes":[
            {
               "host":"127.0.0.1",
               "port":80,
               "weight":1
            },
            {
               "host":"foo.com",
               "port":80,
               "weight":2
            }
         ],
         "hash_on":"vars",
         "update_time":1634543819,
         "key":"remote_addr",
         "create_time":1634539759,
         "id":"1",
         "type":"chash"
      },
      "has_domain":true,
      "key":"\/apisix\/upstreams\/1",
      "createdIndex":938,
      "modifiedIndex":1225
   }
]
GET /v1/upstream/{upstream_id}#
Introduced in v2.11.0.
Dumps the Upstream with the specified upstream_id:
{
   "value":{
      "scheme":"http",
      "pass_host":"pass",
      "nodes":[
         {
            "host":"127.0.0.1",
            "port":80,
            "weight":1
         },
         {
            "host":"foo.com",
            "port":80,
            "weight":2
         }
      ],
      "hash_on":"vars",
      "update_time":1634543819,
      "key":"remote_addr",
      "create_time":1634539759,
      "id":"1",
      "type":"chash"
   },
   "has_domain":true,
   "key":"\/apisix\/upstreams\/1",
   "createdIndex":938,
   "modifiedIndex":1225
}
GET /v1/plugin_metadatas#
Introduced in v3.0.0.
Dumps all plugin_metadatas:
[
    {
        "log_format": {
            "upstream_response_time": "$upstream_response_time"
        },
        "id": "file-logger"
    },
    {
        "ikey": 1,
        "skey": "val",
        "id": "example-plugin"
    }
]
GET /v1/plugin_metadata/{plugin_name}#
Introduced in v3.0.0.
Dumps the metadata with the specified plugin_name:
{
    "log_format": {
        "upstream_response_time": "$upstream_response_time"
    },
    "id": "file-logger"
}
PUT /v1/plugins/reload#
Introduced in v3.9.0
Triggers a hot reload of the plugins.
curl "http://127.0.0.1:9090/v1/plugins/reload" -X PUT
GET /v1/discovery/{service}/dump#
Get memory dump of discovered service endpoints and configuration details:
{
  "endpoints": [
    {
      "endpoints": [
        {
          "value": "{\"https\":[{\"host\":\"172.18.164.170\",\"port\":6443,\"weight\":50},{\"host\":\"172.18.164.171\",\"port\":6443,\"weight\":50},{\"host\":\"172.18.164.172\",\"port\":6443,\"weight\":50}]}",
          "name": "default/kubernetes"
        },
        {
          "value": "{\"metrics\":[{\"host\":\"172.18.164.170\",\"port\":2379,\"weight\":50},{\"host\":\"172.18.164.171\",\"port\":2379,\"weight\":50},{\"host\":\"172.18.164.172\",\"port\":2379,\"weight\":50}]}",
          "name": "kube-system/etcd"
        },
        {
          "value": "{\"http-85\":[{\"host\":\"172.64.89.2\",\"port\":85,\"weight\":50}]}",
          "name": "test-ws/testing"
        }
      ],
      "id": "first"
    }
  ],
  "config": [
    {
      "default_weight": 50,
      "id": "first",
      "client": {
        "token": "xxx"
      },
      "service": {
        "host": "172.18.164.170",
        "port": "6443",
        "schema": "https"
      },
      "shared_size": "1m"
    }
  ]
}
GET /v1/discovery/{service}/show_dump_file#
Get configured services details.
{
  "services": {
    "service_a": [
      {
        "host": "172.19.5.12",
        "port": 8000,
        "weight": 120
      },
      {
        "host": "172.19.5.13",
        "port": 8000,
        "weight": 120
      }
    ]
  },
  "expire": 0,
  "last_update": 1615877468
}