prometheus
This guide shows how to monitor Apache APISIX Ingress Controller using Prometheus and Grafana.
Enable Prometheus#
Use CRD file to enable Prometheus in global configurations. The definition file for custom resources is ApisixClusterConfig, so the configuration should be:
apiVersion: apisix.apache.org/v2
kind: ApisixClusterConfig
metadata:
  name: default
spec:
  monitoring:
    prometheus:
      enable: true
Configure Prometheus Server#
The Prometheus server address should be 127.0.0.1:9090 by default. You can set the target url for apisix-ingress-controller manually in prometheus.yml.
For example:
...
scrape_configs:
  - job_name: "apisix-ingress-controller"
    static_configs:
    - targets: ["localhost:9092"]
According to the above example, the metrics are exposed in http://localhost:9092/metrics now.
Visit http://localhost:9090 in your browser, and select apisix-ingress-controller in targets
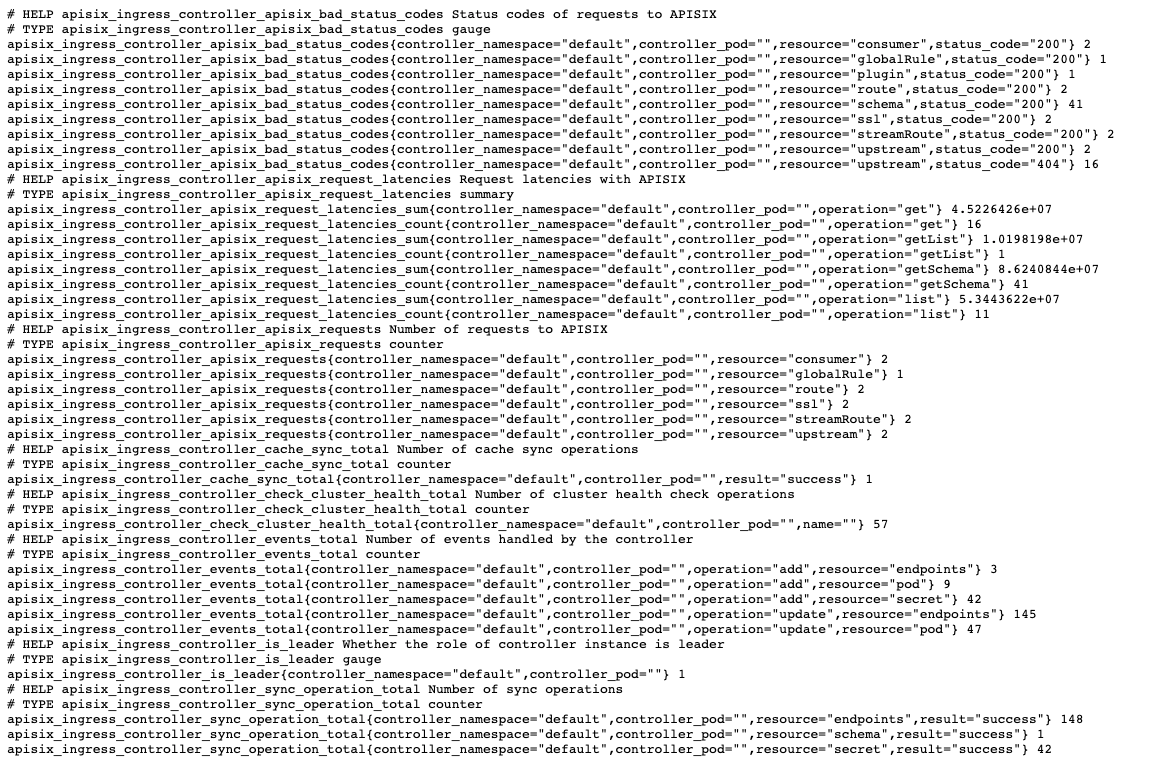
or visit http://localhost:9092/metrics to see the data.
Grafana Dashboard#
Grafana dashboard shows the metrics exposed in Prometheus graphically.
Installing Grafana
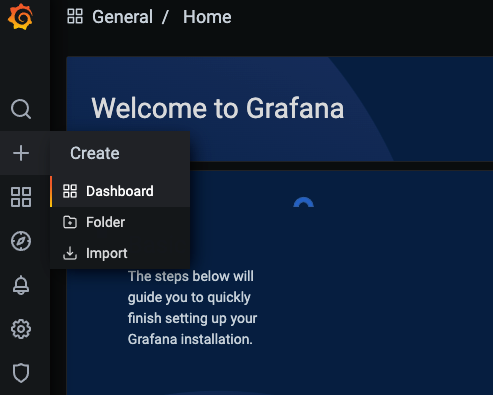
Visit http://localhost:3000/ in your browser to access Grafana. The default username and password are admin.
Then create a new dashboard for apisix-ingress-controller.
Follow the steps to apply the configuration of Grafana Dashboard for apisix-ingress-controller.
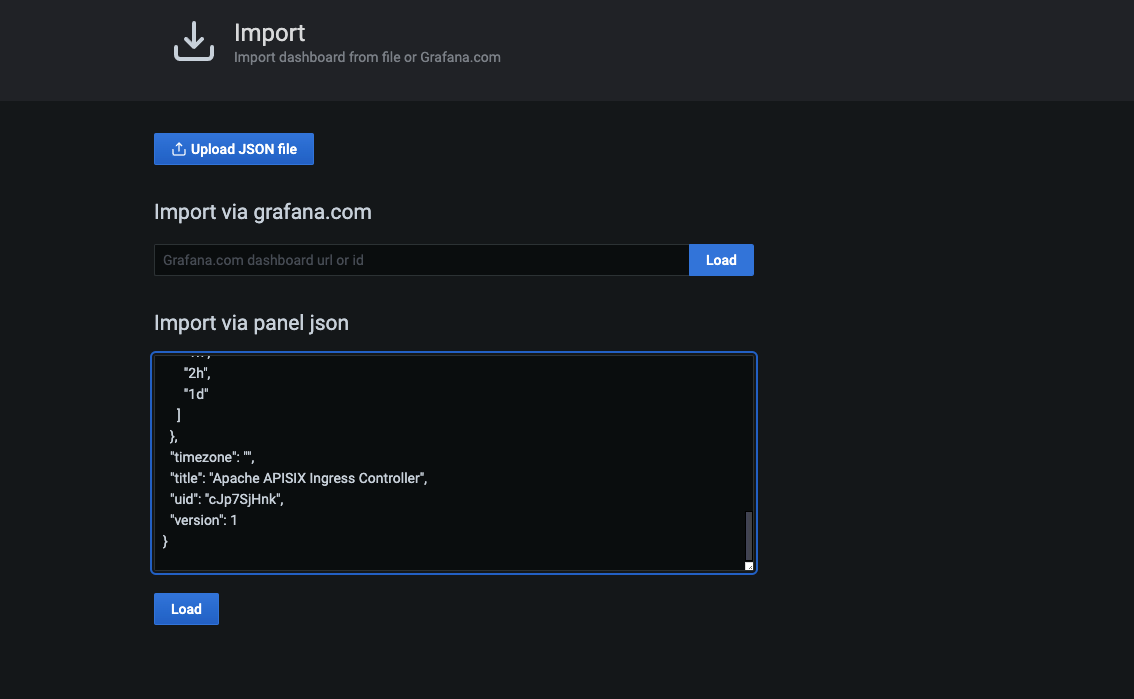
- Add an empty panel, and import via panel json in
apisix-ingress-controller/docs/assets/other/json/apisix-ingress-controller-grafana.json.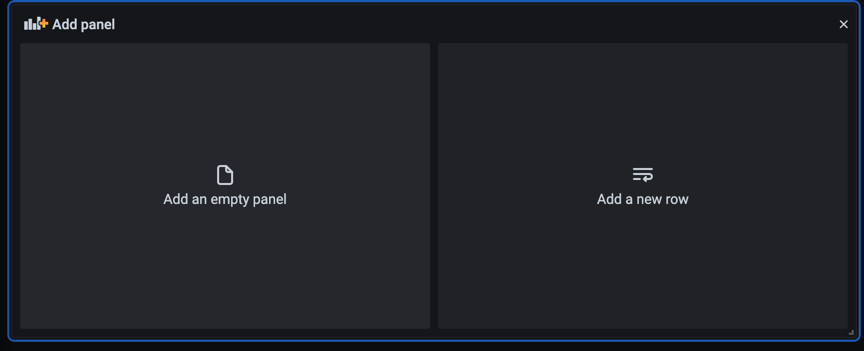
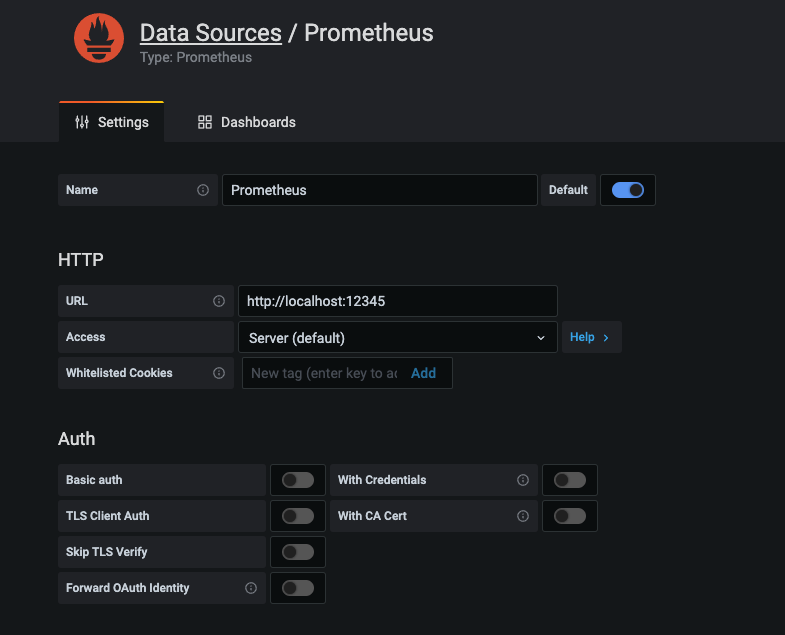
- Select
Prometheus databaseas the datasource. Set the URL according to your Prometheus server configuration.
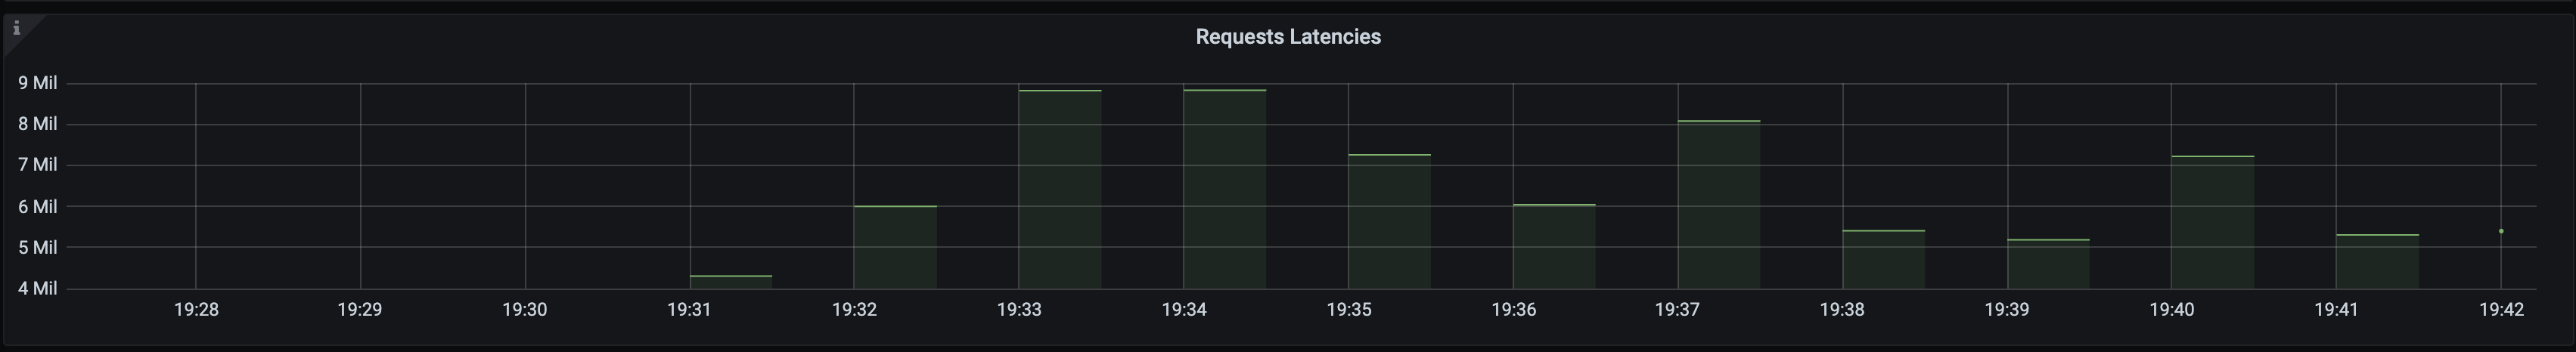
Preview#
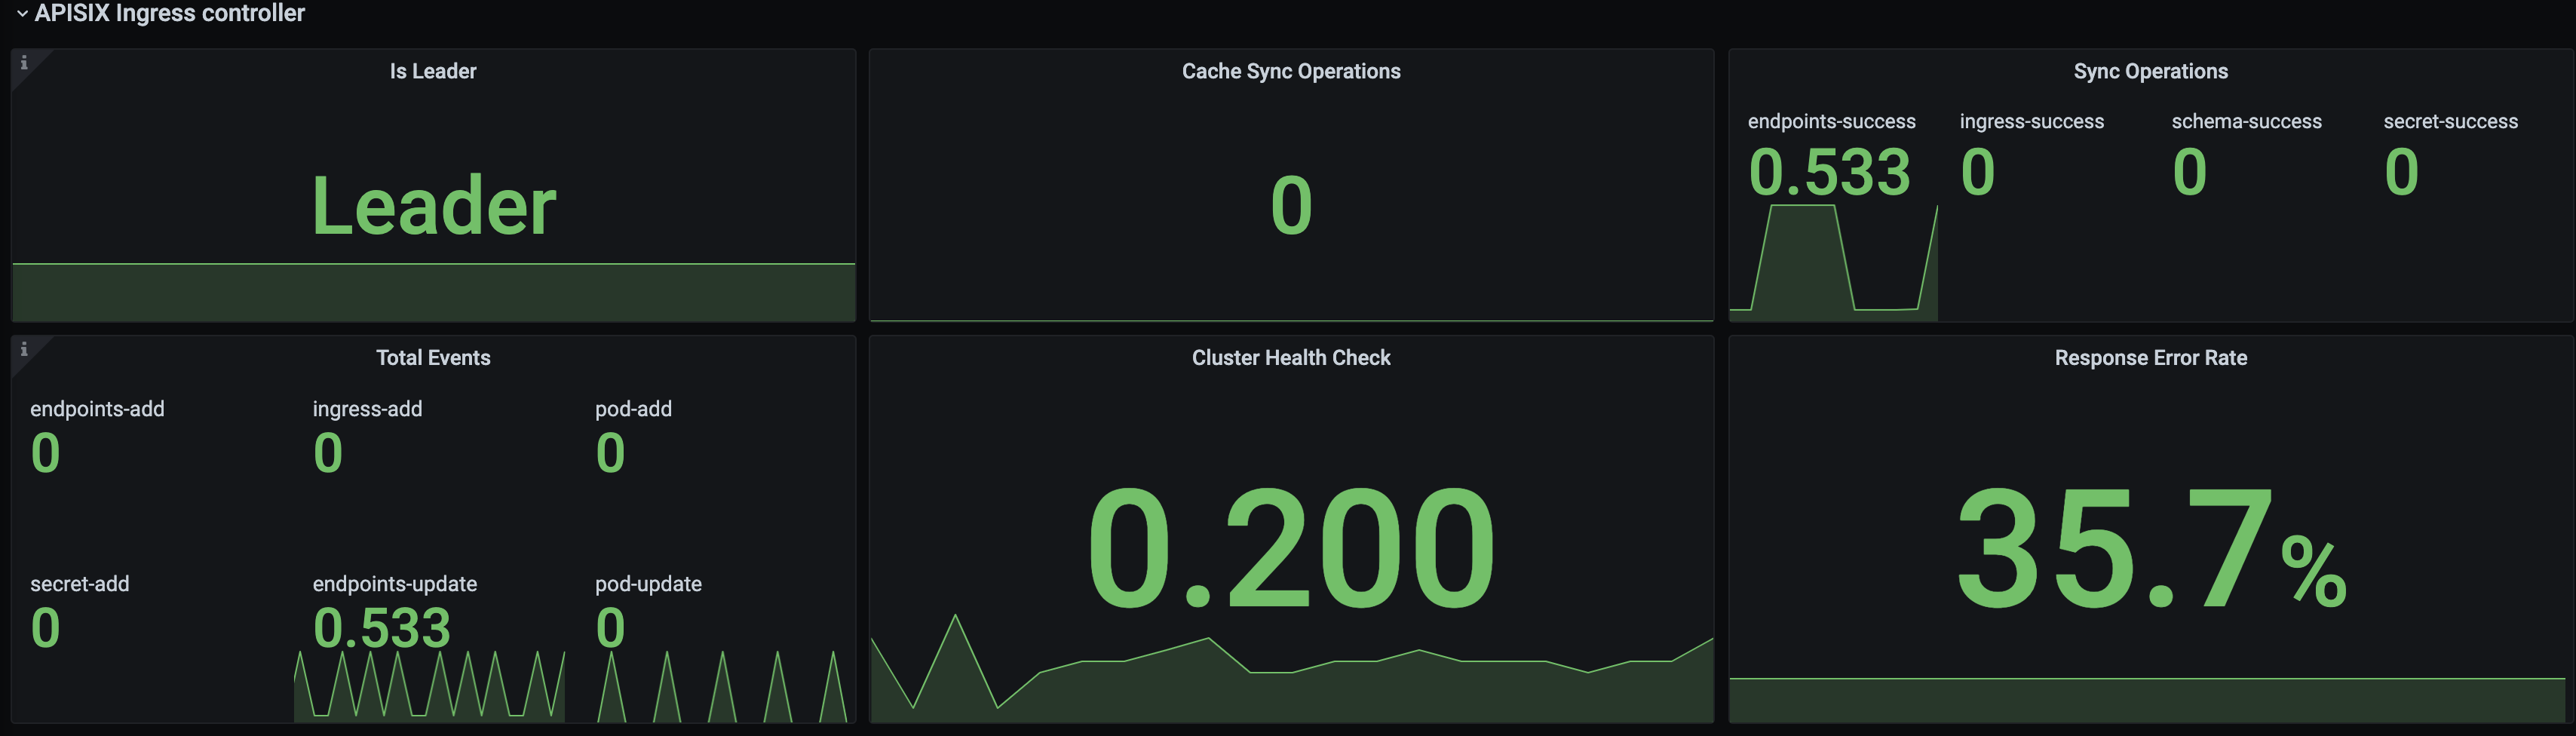
Available metrics#
Is leaderA gauge type metric with value 0 or 1, indicates whether the role of controller instance is leader, for leader is 1 and candidate is 0.
Labels:- controller_pod
- controller_namespace
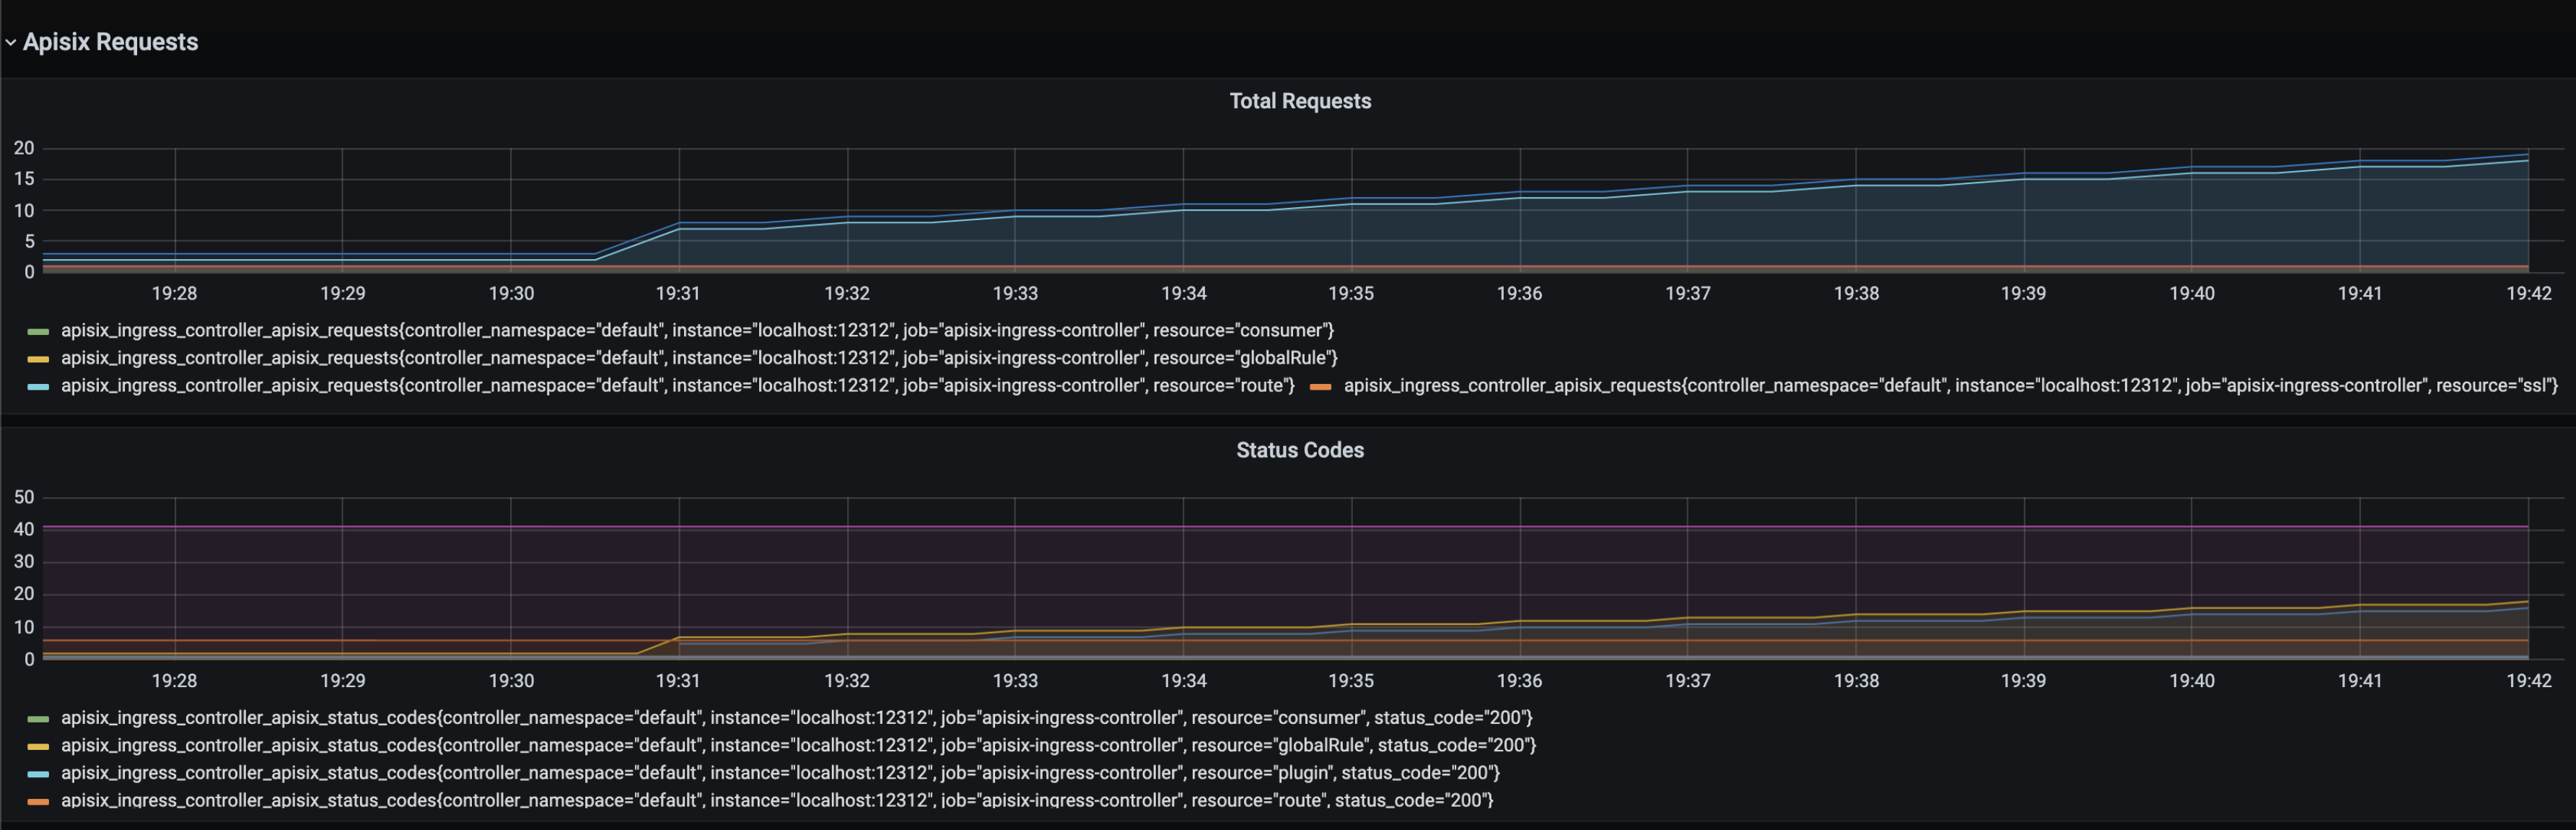
Status codesstatus codes of requests to APISIX.
Labels:- controller_pod
- controller_namespace
- status_code: the HTTP status code returned by APISIX.
- resource
LatencyRequest latencies with APISIX.
Labels:- controller_pod
- controller_namespace
RequestsNumber of requests to APISIX.
Labels:- controller_pod
- controller_namespace
- resource
Check cluster healthNumber of cluster health check operations.
Labels:- controller_pod
- controller_namespace
- name: cluster name.
Sync operationNumber of sync operations.
Labels:- controller_pod
- controller_namespace
- resource
- result: sync success or failure.
Cache syncNumber of cache sync operations.
Labels:- controller_pod
- controller_namespace
- result: sync success or failure.
Controller eventsNumber of events handled by the controller.
Labels:- controller_pod
- controller_namespace
- resource
- operation: includes
add,update,delete.