
In the article "Stable Product Delivery with Cypress", we discussed why we chose Cypress as our E2E testing framework. After spending nearly two months refining the test cases, we needed test coverage to quantify whether the test coverage was sufficient.This article will describe how to get APISIX Dashboard front-end E2E coverage using Cypress.
Source:
What is code coverage
Code coverage is a metric in software testing that describes the proportion and extent to which the source code in a program is tested, and the resulting proportion is called code coverage. Test code coverage reflects the health of the code to a certain extent.
Installation Dependencies & Configuration
To collect test coverage data, we need to put some probes in the original business code for Cypress to collect the data.
Cypress officially recommends two approaches, the first is to generate a temporary directory via nyc and run the code that has been written to the probe to collect test coverage data. The second way is to do the code conversion in real time through the code conversion pipeline, which eliminates the hassle of temporary folders and makes collecting test coverage data relatively refreshing. We choose the second way to collect front-end E2E coverage.
- Installing Dependencies
yarn add babel-plugin-istanbul --dev
- Install the cypress plug-in
yarn add @cypress/code-coverage --dev
- Configuring babel
// web/config/config.ts
extraBabelPlugins: [
    ['babel-plugin-istanbul',  {
      "exclude": ["**/.umi", "**/locales"]
    }],
  ],
- Configuring Cypress code coverage plugin
// web/cypress/plugins/index.js
module.exports = (on, config) => {
  require('@cypress/code-coverage/task')(on, config);
  return config;
};
// web/cypress/support/index.js
import '@cypress/code-coverage/support';
- Get Test Coverage
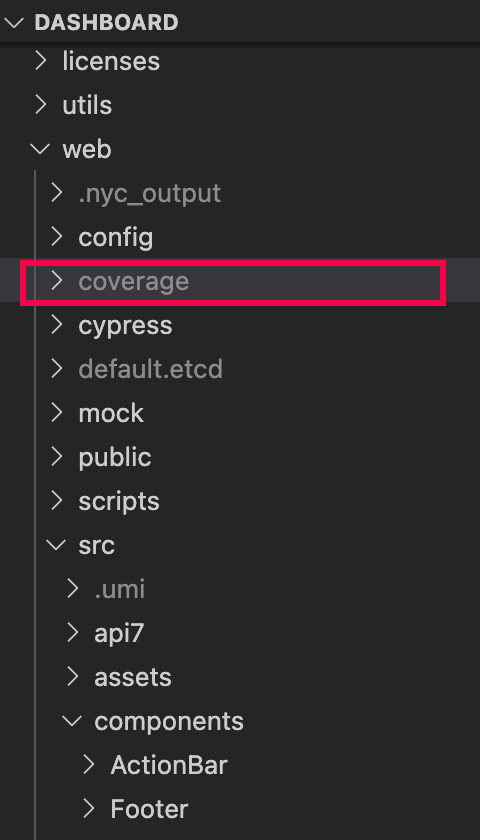
After the configuration is done, we need to run the test case. After the test case is run, Cypress will generate coverage and .nyc_output folders, which contain the test coverage reports.
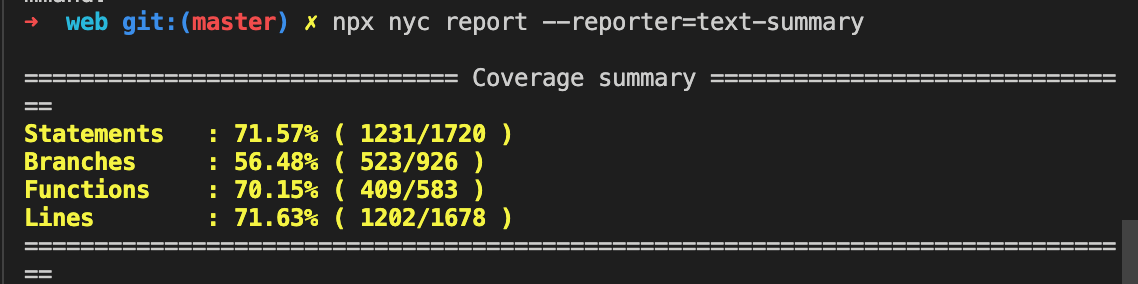
The test coverage information will appear in the console after executing the following command.
npx nyc report --reporter=text-summary
Under the coverage directory, a more detailed report page will be available, as shown here.
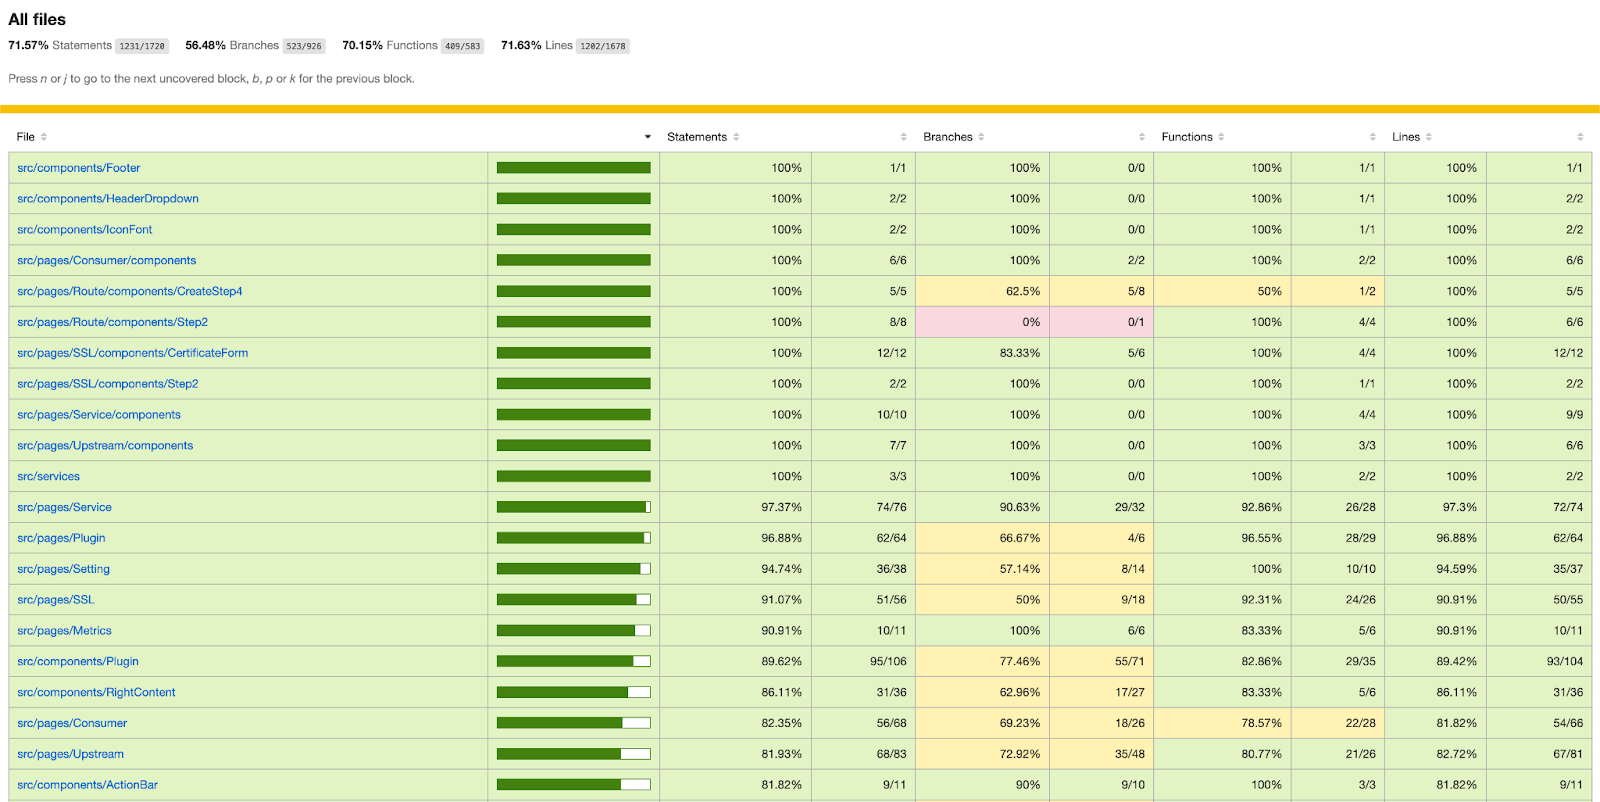
Statements indicates whether each statement was executed
Branches indicates whether each if block was executed
Functions indicates whether each function is called
Lines indicates whether each line was executed
Summary
The test coverage rate reflects the quality of the project to a certain extent. At present, APISIX Dashboard front-end E2E coverage rate has reached 71.57%. We will continue to work with the community to enhance the test coverage rate and provide more reliable and stable products for users.