

This article introduces the observability capabilities of Apache APISIX and how to improve the observability capabilities of Apache APISIX through Apache SkyWalking.
Observability is the ability to observe the runtime state and resource usage of the internal program of the system from the outside of the system. The main measures of observability are Metrics, Logging, and Tracing, and the following diagram shows the relationship between Metrics, Logging, and Tracing.
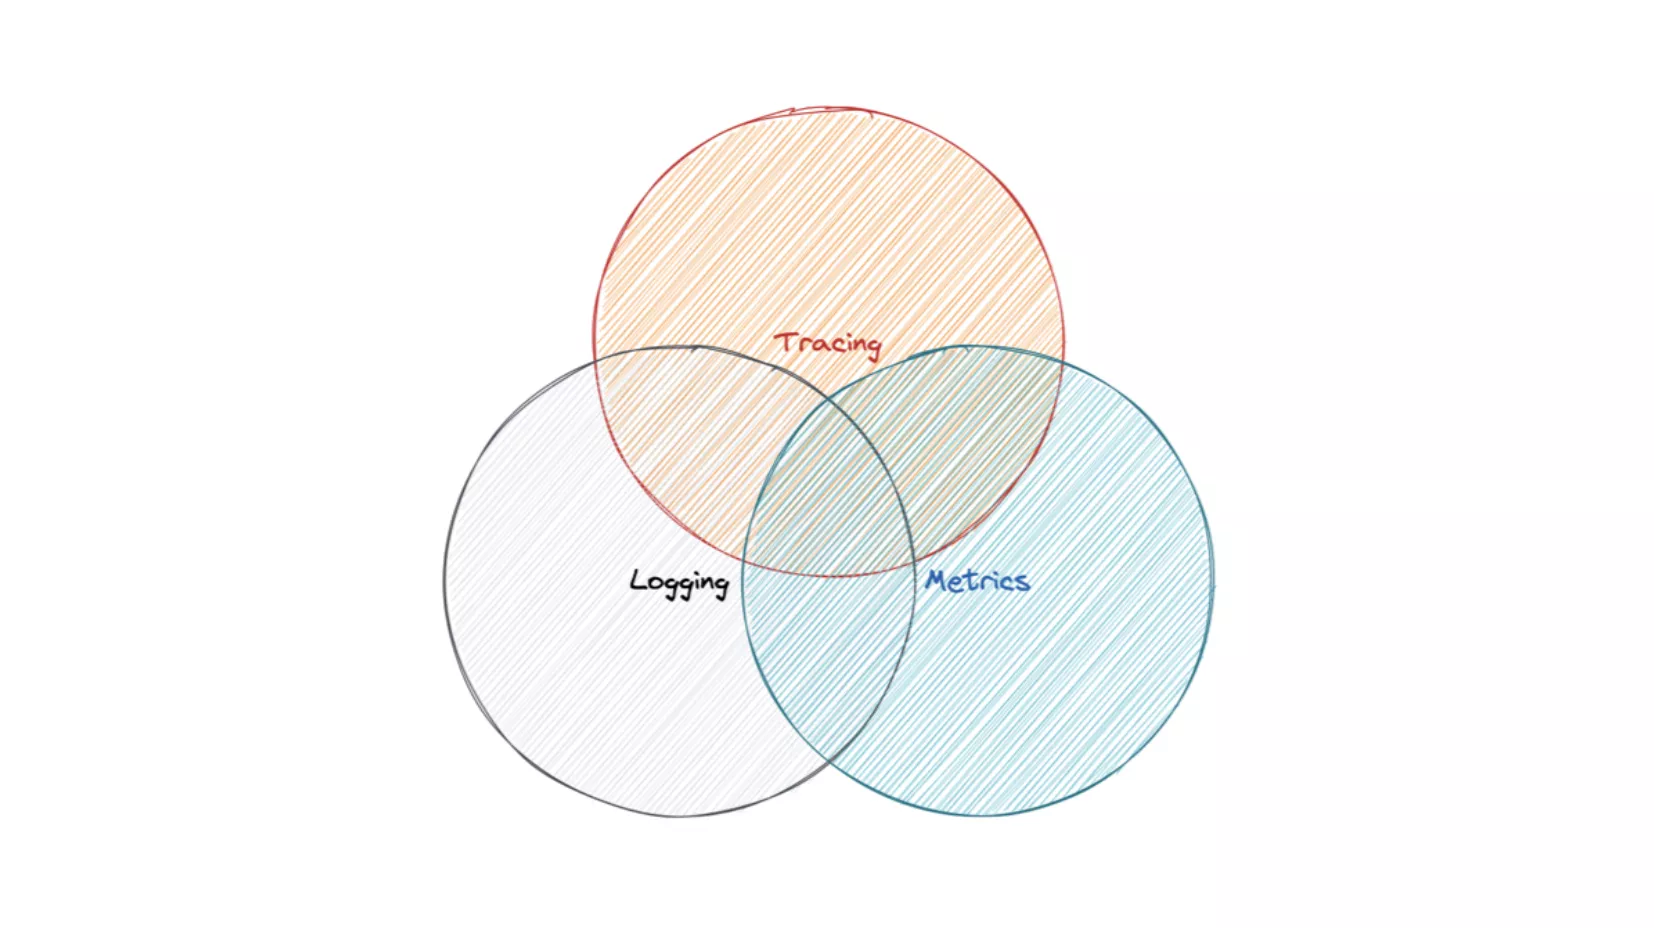

For example, the overlap between Tracing and Logging represents the logs generated by Tracing at the request level, and the Tracing ID is used to associate Tracing and Logging. After performing certain aggregation operations on this log, some Metrics can be obtained. Tracing itself also generates some Metrics, such as the relationship between the call volume.
Observability Capabilities of Apache APISIX
Apache APISIX has comprehensive observability capabilities: support for Tracing and Metrics, a rich ecosystem of Logging plug-ins, and support for querying node status.
Tracing
Apache APISIX supports a variety of Tracing plugins, including: Zipkin, OpenTracing and SkyWalking. Note that: Tracing plug-in is closed by default, you need to manually open Tracing plug-in before use. Tracing plugin needs to be bound to routing or global rules. If there is no requirement for sampling rate, it is recommended to bind to global rules to avoid omissions.
Metrics
In Apache APISIX, Metrics related information is reported through Prometheus Exporter, which is compatible with the Prometheus data format. There are two things to be aware of when using the Prometheus Plugin in Apache APISIX.
First, please try to improve the readability of the names of all three - route, service and upstream.
There is a parameter named prefer_name in Prometheus Plugin. When the value of this parameter is set to true, that is: prefer_name: true. If the names of routing, service and upstream are relatively readable, This will bring some benefits: when you monitor the parameters on the large screen through Grafana, you can not only clearly display all the data, but also clearly know the source of the data. If the value of the prefer_name parameter is false, only the ID of the resource will be displayed as the data source, such as the routing ID and upstream ID, which will cause the problem of low readability of the monitor screen.
Second, the Prometheus Plugin must be bound to a route or global rule before it can view the metrics of the specified resource.
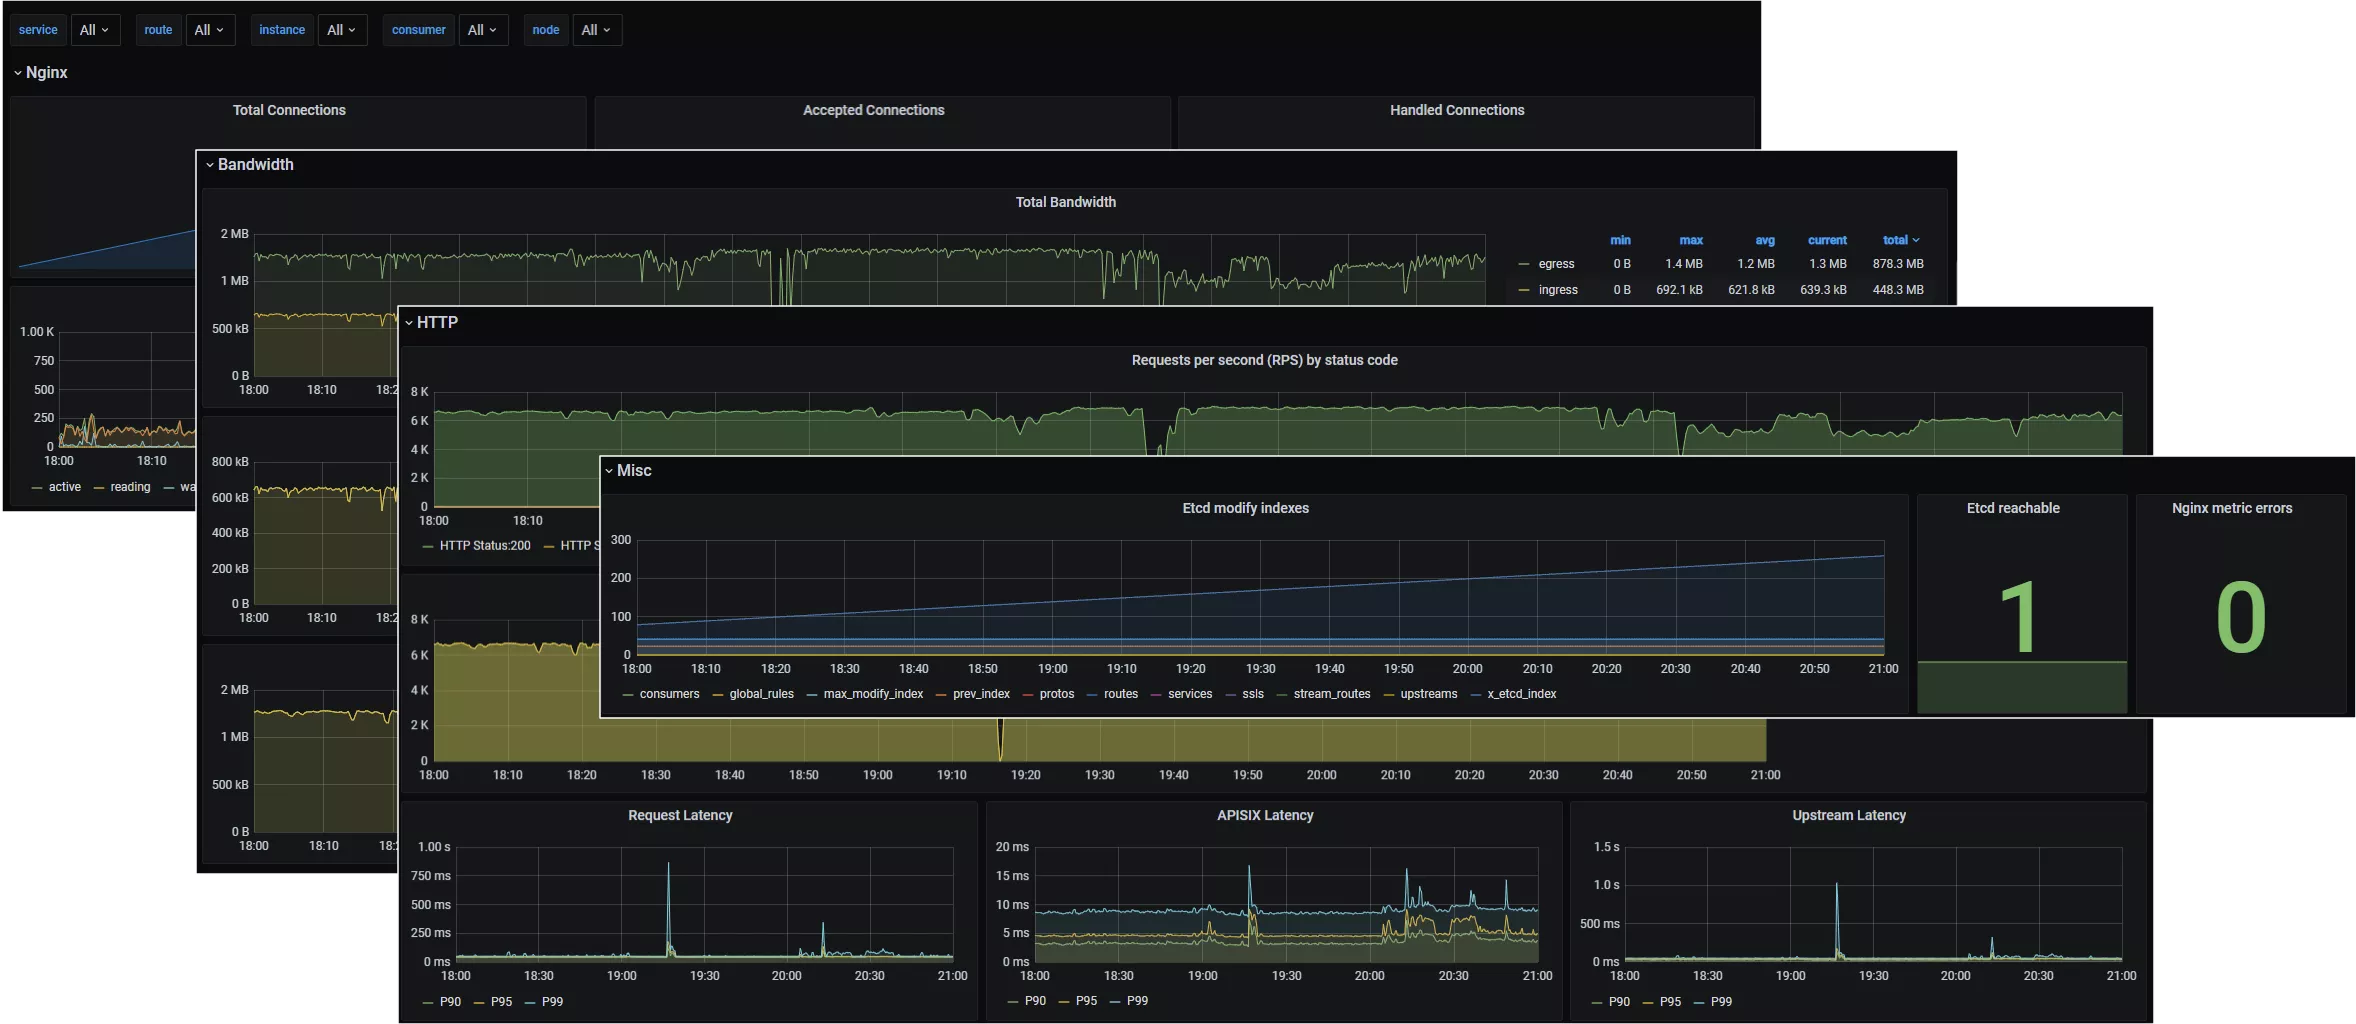
After the above setup, the Metrics data will be stored in Prometheus. Since Prometheus has good storage performance, but poor display performance, we need to use the Grafana Dashboard to display the data. We can see the Metrics for the Nginx instance, the Metrics for the network bandwidth, the Metrics for the routes and upstream, and more, as shown in the following image.

Logging
Apache APISIX supports a variety of logging plugins to share log data directly with other external platforms. The Error Log plug-in supports HTTP and TCP protocols, and is compatible with the log format of SkyWalking. Logs can also be synchronized to logging platforms for processing through log collection components such as FluentBit.
The Access Log plugin does not currently support nesting inside the log format. Because the Access Log plugin is route-level, it needs to be bound to a route in order to collect access logs for the route. However, the log format is global, and there can only be one global log format.
Support Querying Node Status
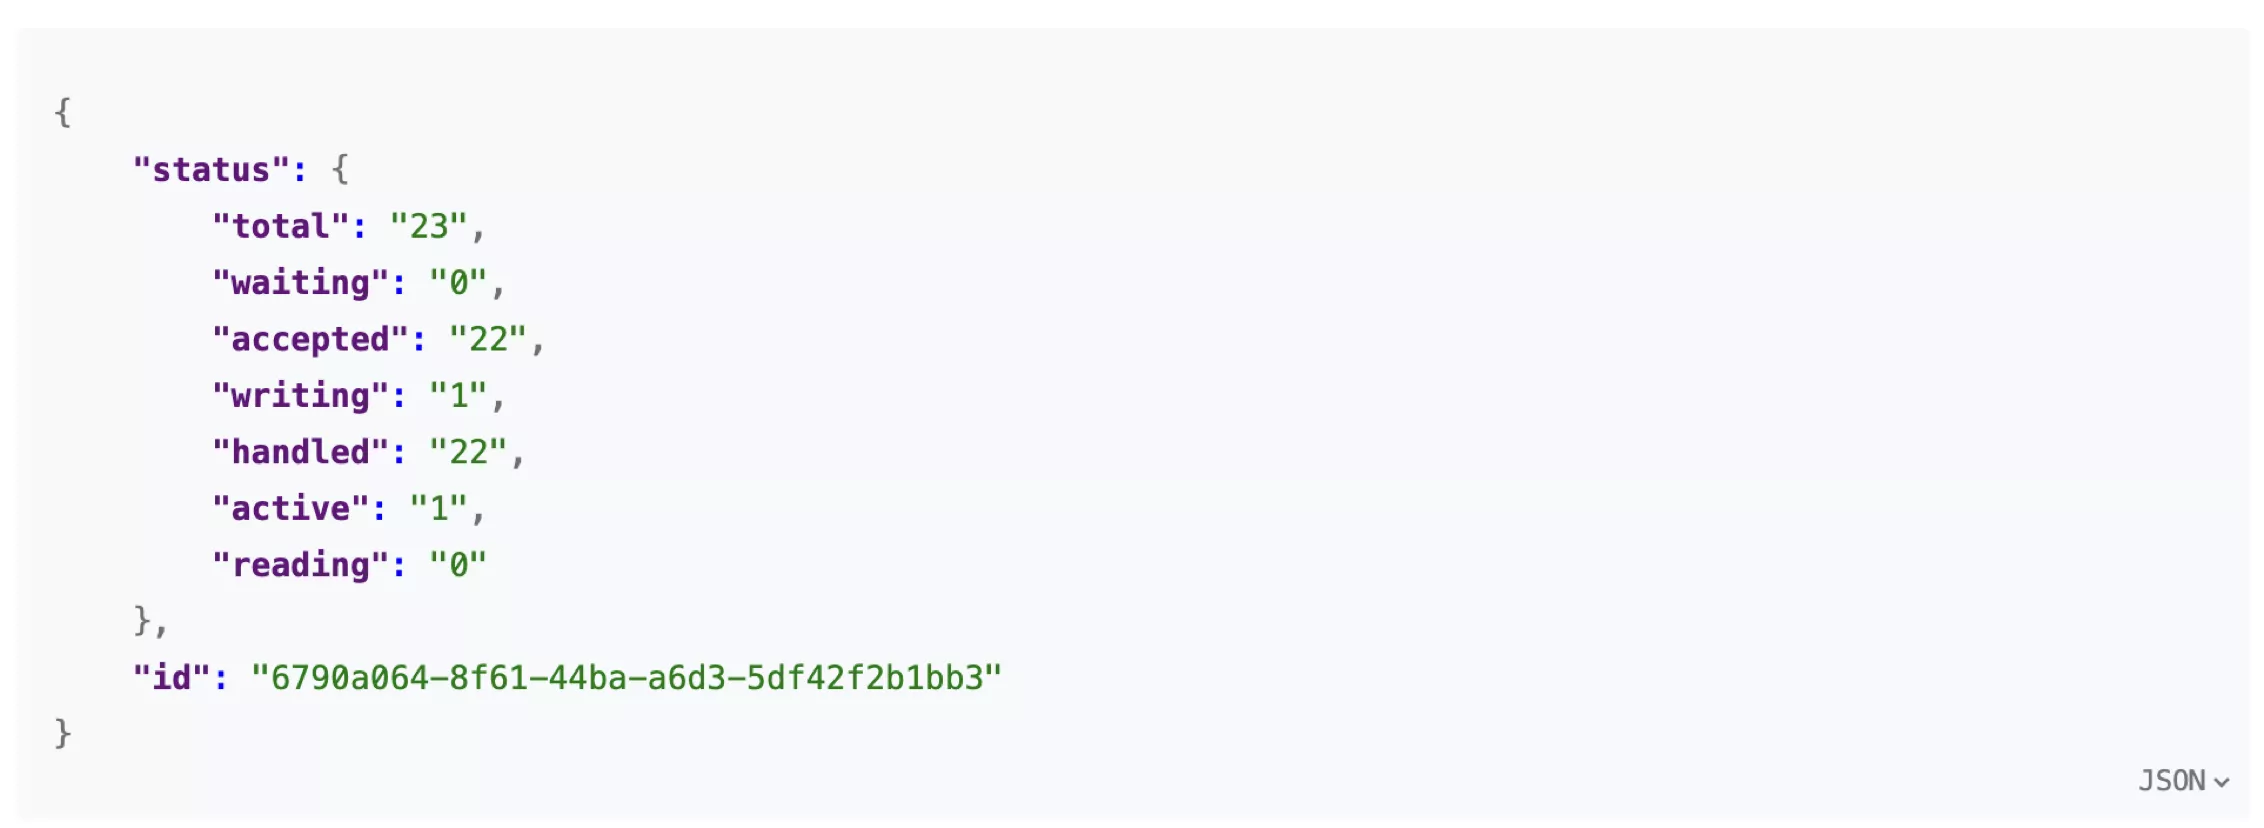
Apache APISIX supports querying node status. When enabled, information about the nodes can be collected via /apisix/status, including the number of nodes, the number of waiting links, the number of connections processed, etc.

Pitfalls
As mentioned above, Apache APISIX has a well-established observability capability to collect information such as Metrics, Logging, and Tracing. Although the built-in plug-in of Apache APISIX and Grafana Dashboard can solve the problems of monitoring data collection and indicator visualization, all kinds of data are scattered on various platforms. It is expected that an observability analysis platform can integrate Metrics, Logging, and Tracing information and link all data together.
Use Apache SkyWalking to Enhance the Observation Capabilities of Apache APISIX
Apache SkyWalking is an application performance monitoring (APM) and observability analysis platform for distributed systems. It provides multi-dimensional application performance analysis methods, from distributed topology diagrams to application performance indicators, traces, log correlation analysis and alarms.
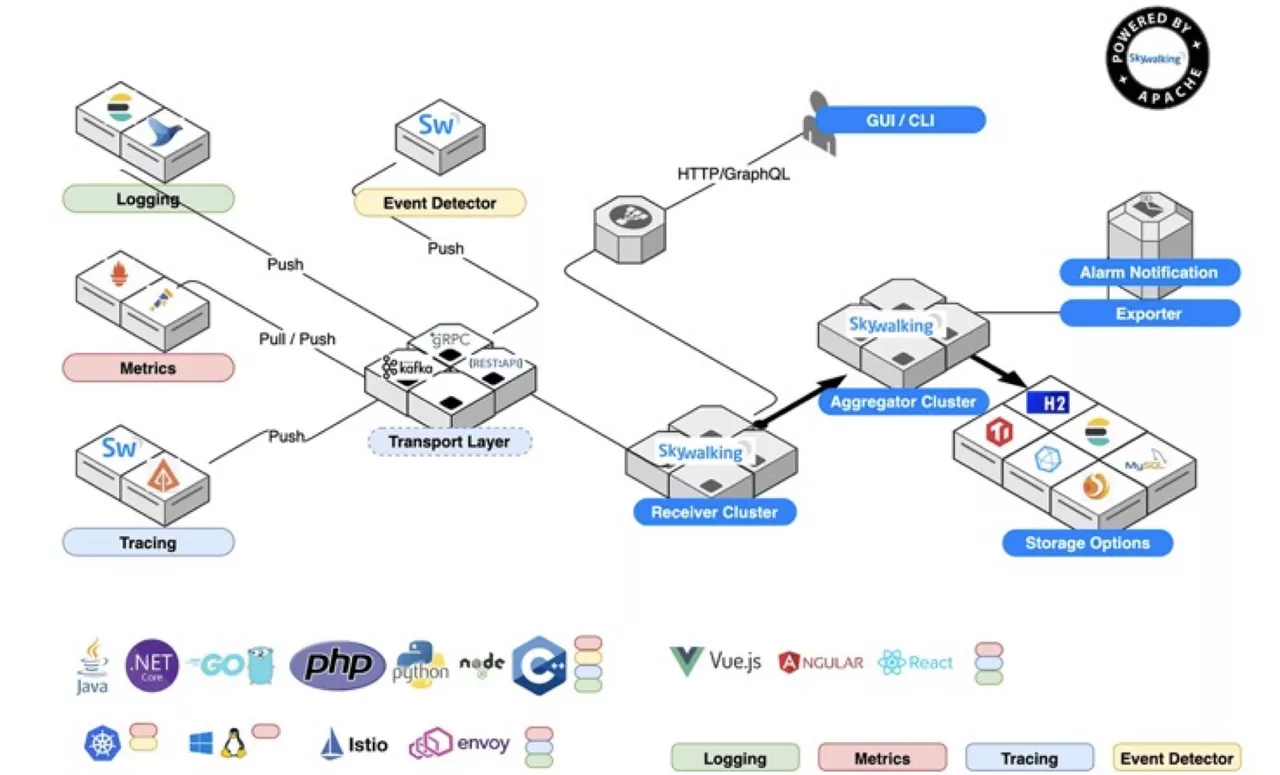

One-stop Data Processing
Apache SkyWalking supports interfacing with Metrics, Logging, Tracing and other monitoring data, compatible with the Prometheus data model, and can also be used to generate new Metrics through secondary aggregation by Log Analysis Language.
More Detailed Data Presentation
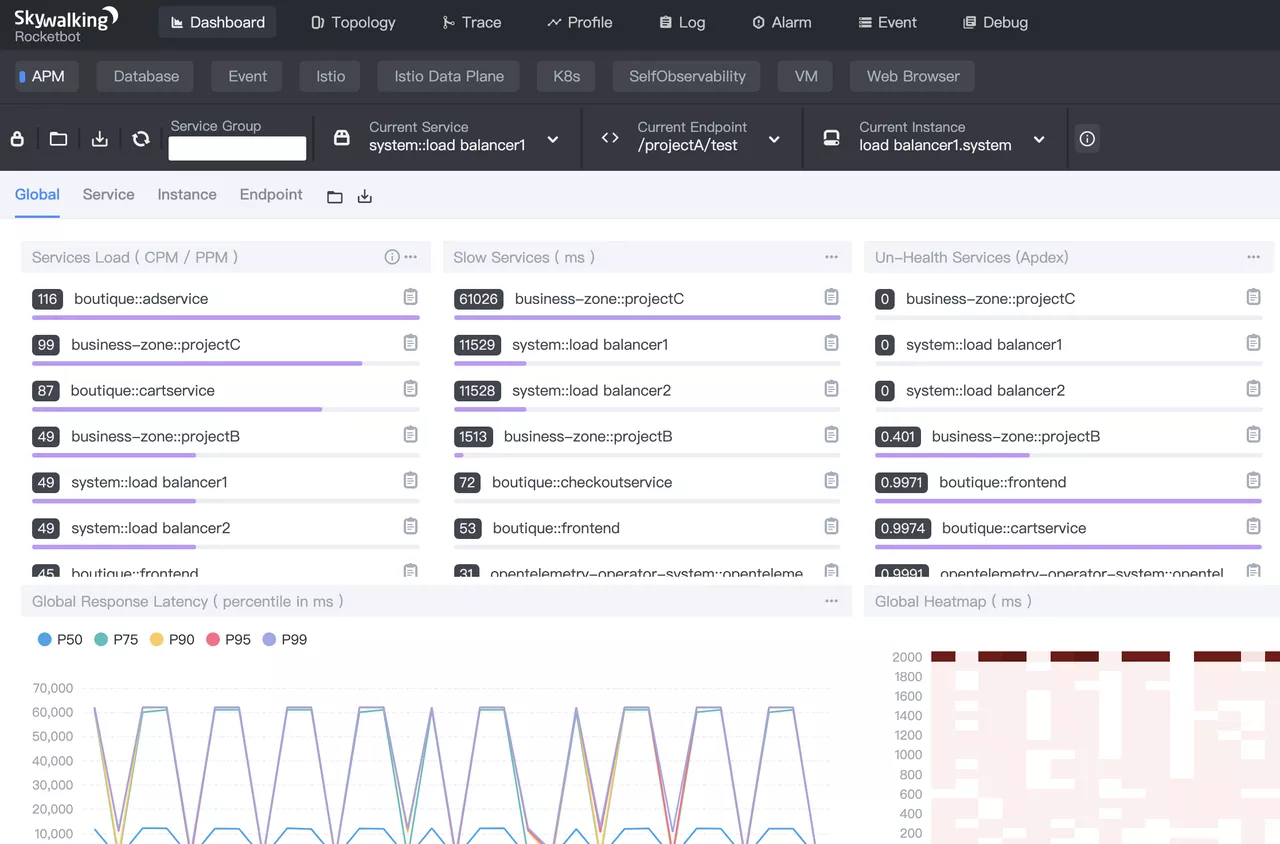
The Dashboard of Apache SkyWalking is divided into two areas: the upper area for feature selection and the lower area for panel content. The upper part is the feature selection area, and the lower part is the content of the dashboard, which provides Metrics related information in multiple entity dimensions, such as Global, Service, Example, Endpoint, etc., and supports different views to show the observability. Take the global view as an example, the displayed Metrics include: service load, number of slow services, number of unhealthy services, etc., as shown in the figure below.

Another thing worth mentioning is the Trace view of SkyWalking Dashboard. SkyWalking provides 3 display forms: list, tree diagram and table. Trace view is a typical view of distributed tracing. These views allow users to view trace data from different angles, especially the time-consuming relationship between spans.
SkyWalking Dashboard also supports topology diagrams. The topology diagram is the overall topology structure analyzed based on the probe uplink data. The topology diagram supports clicking to show and drill down the performance statistics, tracing, and alerts of individual services, and you can also click on the relationship lines in the topology diagram to show the performance Metrics between services and between service examples.
Support Containerized Deployments
Kubernetes is an open source cloud-native containerized cluster management platform that aims to make deploying containerized applications simple and efficient. The Apache SkyWalking backend can be deployed in Kubernetes, and thanks to the efficient management of Kubernetes, high availability of UI components can be guaranteed.
If Apache APISIX is deployed on a cluster, Apache SkyWalking supports the deployment of SkyWalking Satellite in the form of sidecar or service discovery to monitor Apache APISIX in the cluster.
Future Plans
Apache APISIX will continue to enhance observability-related feature support in the future, such as
Solve the problem of missing peer of SkyWalking Nginx-Lua plugin
Support printing trace id in the log
Access to the access log
Support gateway metadata
Conclusion
This article introduces the observability capabilities of Apache APISIX and how Apache SkyWalking can enhance the observability capabilities of Apache APISIX. The two communities will continue to work together to further enhance the observability of Apache APISIX in the future. We hope you can get more involved in the Apache APISIX and Apache SkyWalking projects. If you are interested in these two open source projects but are not familiar with the code, writing articles, making videos, sharing them externally, and actively participating in community and mailing list discussions are all great ways to get involved.