Monitor APISIX Ingress Controller with Prometheus
This article introduces the relevant steps of how to use Prometheus to monitor APISIX Ingress Controller and the display effect of some indicators.
Whether in the days of monolithic applications or today’s cloud-native era, “monitoring functions” have always played a very important role. A good monitoring system can help engineers quickly understand the status of services running in production environments, and quickly locate problems or warn of anomalies when they occur.
Apache APISIX Ingress Controller has been enhanced to support Prometheus Metrics in recent releases. In this article, we will introduce how to use Prometheus to collect Metrics data from APISIX Ingress Controller and subsequently visualize it through Grafana.
Step 1: Install APISIX Ingress Controller
First we deploy Apache APISIX, ETCD and APISIX Ingress Controller to the local Kubernetes cluster via Helm.
helm repo add apisix https://charts.apiseven.com
helm repo update
kubectl create namespace ingress-apisix
helm install apisix apisix/apisix --namespace ingress-apisix \
 --set ingress-controller.enabled=true
After installation, please wait until all services are up and running. Specific status confirmation can be checked with the following command.
kubectl get all -n ingress-apisixStep 2: Enable the Prometheus Plugin
In most cases, the monitoring function must involve more than just the APISIX Ingress Controller component. If you need to monitor Apache APISIX at the same time, you can create the following ApisixClusterConfig resource.
Installing Prometheus and Grafana
Next, we will enable the Prometheus service through the Prometheus Operator, so you will need to install the Prometheus Operator first.
NOTE
The following command will also install Grafana.
helm repo add prometheus-community https://prometheus-community.github.io/helm-charts
heml repo update
kubectl create namespace prometheus
helm install prometheus prometheus-community/kube-prometheus-stack -n prometheus
After installation, you need to prepare the RBAC configuration for the Prometheus instance. This configuration gives Prometheus the ability to obtain Pod and Service resources from the Kubernetes API Server.
apiVersion: v1
kind: ServiceAccount
metadata:
  name: ingress-apisix
  namespace: ingress-apisix
---
apiVersion: rbac.authorization.k8s.io/v1
kind: ClusterRole
metadata:
  name: ingress-apisix
rules:
- apiGroups: [""]
  resources:
  - nodes
  - nodes/metrics
  - services
  - endpoints
  - pods
  verbs: ["get", "list", "watch"]
- apiGroups: [""]
  resources:
  - configmaps
  verbs: ["get"]
- apiGroups:
  - networking.k8s.io
  resources:
  - ingresses
  verbs: ["get", "list", "watch"]
- nonResourceURLs: ["/metrics"]
  verbs: ["get"]
---
apiVersion: rbac.authorization.k8s.io/v1
kind: ClusterRoleBinding
metadata:
  name: ingress-apisix
roleRef:
  apiGroup: rbac.authorization.k8s.io
  kind: ClusterRole
  name: ingress-apisix
subjects:
- kind: ServiceAccount
  name: ingress-apisix
  namespace: ingress-apisix
After completing the above instance configuration, PodMonitor needs to be defined, or you can choose to use ServiceMonior depending on the scenario requirements. The following PodMonitor resources will focus on Metrics collection for the APISIX Ingress Controller Pod.
apiVersion: monitoring.coreos.com/v1
kind: PodMonitor
metadata:
  name: ingress-apisix
  namespace: ingress-apisix
  labels:
    use-for: ingress-apisix
spec:
  selector:
    matchLabels:
      app.kubernetes.io/name: ingress-controller
  podMetricsEndpoints:
  - port: http
NOTE
The reason for not using ServiceMonitor here is that the http port is not exposed to the Service level.
Finally, the Prometheus instance can be defined with the following command.
apiVersion: monitoring.coreos.com/v1
kind: Prometheus
metadata:
  name: ingress-apisix
  namespace: ingress-apisix
spec:
  serviceAccountName: ingress-apisix
  podMonitorSelector:
    matchLabels:
      use-for: ingress-apisix
  resources:
    requests:
      memory: 400Mi
  enableAdminAPI: false
  image: prom/prometheus:v2.31.0
After applying all of the above resources to the Kubernetes cluster, wait for the relevant components to be ready.
Step 3: Configuring Grafana
Next, we configure Grafana for visual presentation.
Start by accessing the prometheus-grafana service. Note that if you do not have a means to expose the service to the outside of the cluster, you can try using port forwarding. The Grafana administrator username and password are stored in the prometheus-grafana Secret.
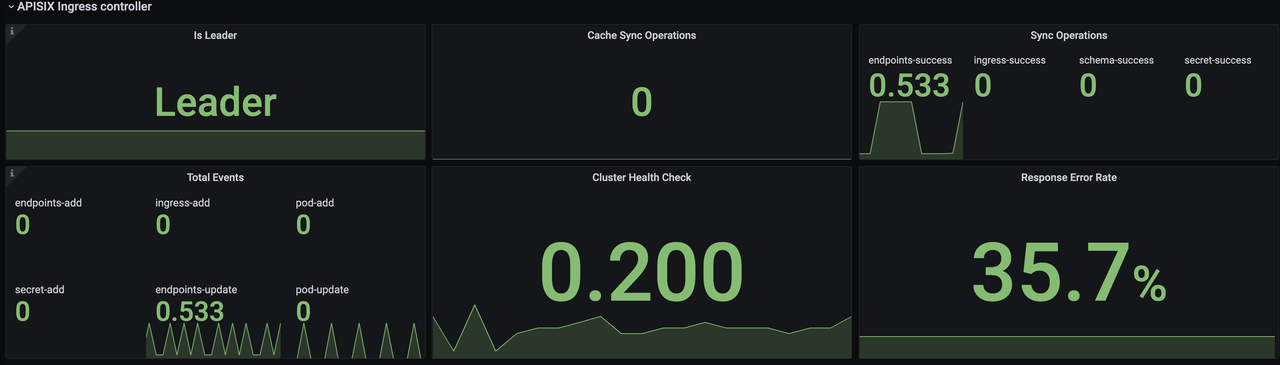
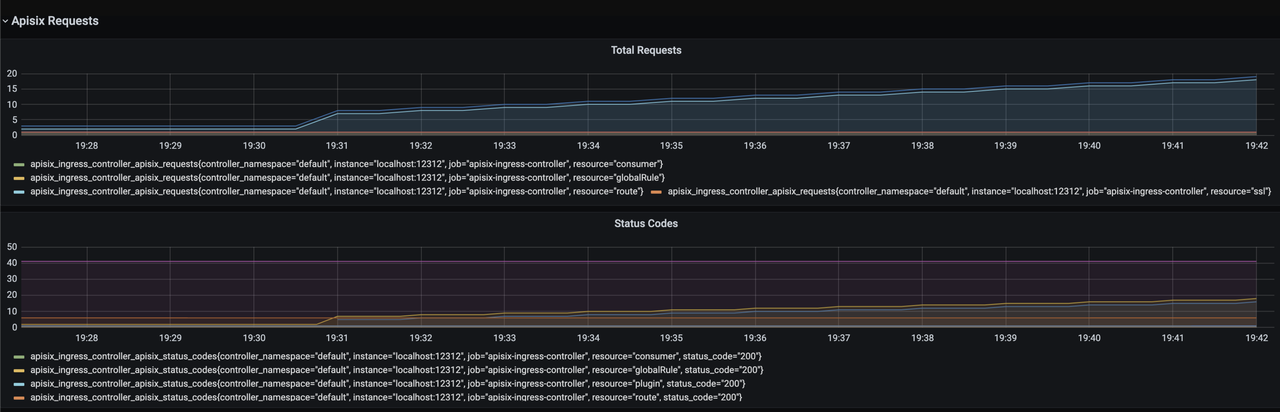
After opening Grafana, import the Dashboard template of APISIX Ingress Controller to see the monitoring dashboard, which looks like the following.
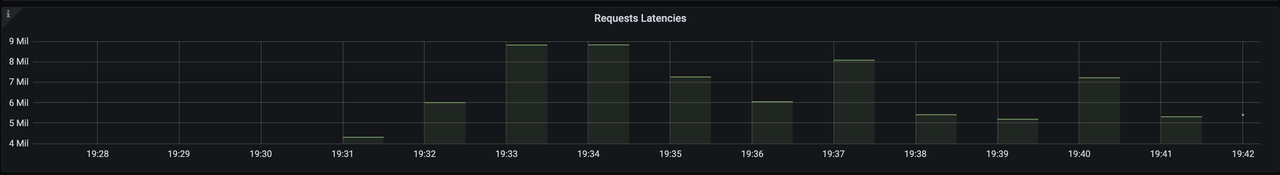
For more information on creating Dashboard templates, please see related PR.
Addendum: Monitoring Metrics Explained
The current monitoring metrics for the APISIX Ingress Controller focus on its interaction with the data plane Apache APISIX instances (configuration delivery), including data related to the number and latency of configuration synchronization.
is_leader: Whether the current APISIX Ingress Controller instance is in the Leader role. The same group of APISIX Ingress Controllers will have only one Leader, the rest of the instances are Candidate.sync_operations: Includes some metrics when the APISIX Ingress Controller synchronizes the configuration to the data plane, including the number of pushes, failure rate, latency, etc. Through these metrics, you can monitor whether the configuration delivery is normal or not, so as to help R&D and operation and maintenance students to monitor and alert and locate faults.
Summary
This article introduced how to use Prometheus to monitor APISIX Ingress Controller and how to display some of the metrics. Currently, only some basic monitoring metrics are included, we will continue to polish and upgrade, add more metrics and integrate data surface APISIX metrics to bring you a better monitoring experience.
Of course, interested parties are welcome to contribute to the Apache APISIX Ingress Controller project, and we look forward to working together to make the APISIX Ingress Controller more comprehensive.