API Observability with APISIX Plugins
This article describes the power of some Apache APISIX Observability Plugins, how to set up these plugins and use them to understand API behavior.

APIs are everywhere
APIs — by now, we’re all familiar with the term. Every service we use today either uses an API or is an API itself. APIs are central in building and delivering your services. Also, you know that the success of your services depends on the integrity, availability, and performance of your APIs.
Nowadays API Observability is already a part of every API development as it addresses many problems related to API consistency, reliability, and the ability to quickly iterate on new API features. When you design for full-stack observability, you get everything you need to find issues and catch breaking changes.
API observability can help every team in your organization:
-
Sales and growth teams to monitor your API usage, free trials, observe expansion opportunities and ensure that API serves the correct data.
-
Engineering teams to monitor and troubleshoot API issues.
-
Product teams to understand API usage and business value.
-
Security teams to detect and protect from API threats.
A central point for observation
We know that an API gateway offers a central control point for incoming traffic to a variety of destinations but it can also be a central point for observation as well since it is uniquely qualified to know about all the traffic moving between clients and our service networks. Instead of spending time integrating your services with other many APIs and technologies to improve observability, you can easily manage all work with Apache APISIX Plugins.
Most observability platforms like (Prometheus, SkyWalking, and Opentelemetry) provide pre-built connectors that you can easily integrate with Apache APISIX. You can leverage these connectors to ingest log data from your API gateways to further derive useful metrics and gain complete visibility into the usage, management performance, and security of your APIs in your environment.
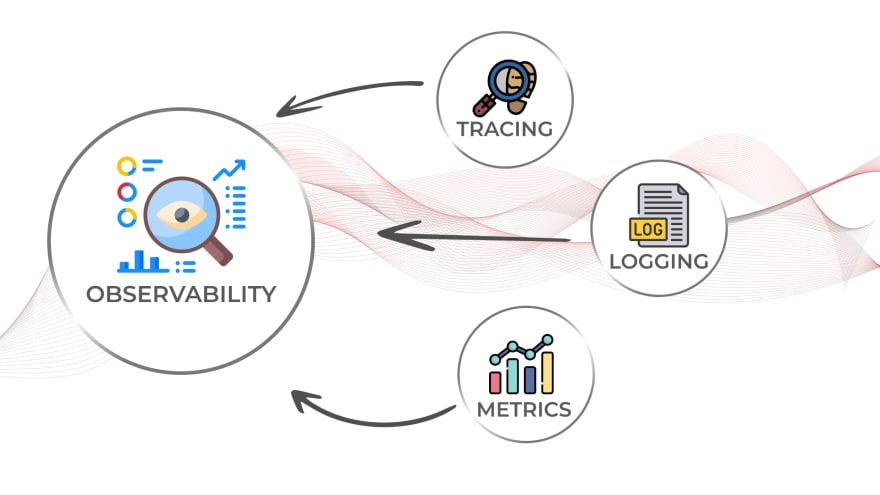
The core of observability breaks down into three key areas: structured logs, metrics, and traces. Let’s break down each pillar of API observability and learn how with Apache APISIX Plugins we can simplify these tasks and provides a solution that you can use to better understand API usage.
Prerequisites
Before enabling our plugins we need to install Apache APISIX, create a route, an upstream, and map the route to the upstream. You can simply follow getting started guide provided on the website.
Logs
Logs are also easy to instrument and trivial steps of API observability, they can be used to inspect API calls in real-time for debugging, auditing, and recording time-stamped events that happened over time. There are several logger plugins Apache APISIX provides such as:
And you can see the full list on the official website of Apache APISIX. Now for demo purposes, let’s choose a simple but mostly used http-logger plugin that is capable of sending API Log data requests to HTTP/HTTPS servers or sends as JSON objects to Monitoring tools. We can assume that a route and an upstream are created. You can learn how to set up them in the Getting started with Apache APISIX video tutorial. Also, you can find all command-line examples on the GitHub page apisix-observability-plugins.
You can generate a mock HTTP server at mockbin.com to record and view the logs. Note that we also bind the route to an upstream (You can refer to this documentation to learn about more core concepts of Apache APISIX).
The following is an example of how to enable the http-logger for a specific route.
curl http://127.0.0.1:9080/apisix/admin/routes/1 \-H 'X-API-KEY: edd1c9f034335f136f87ad84b625c8f1' -X PUT -d '
{
    "plugins": {
          "http-logger": {
              "uri": "http://mockbin.org/bin/5451b7cd-af27-41b8-8df1-282ffea13a61"
          }
     },
    "upstream_id": "1",
    "uri": "/get"
}'
To http-logger plugin settings, your can just put your mock server URI address like below:
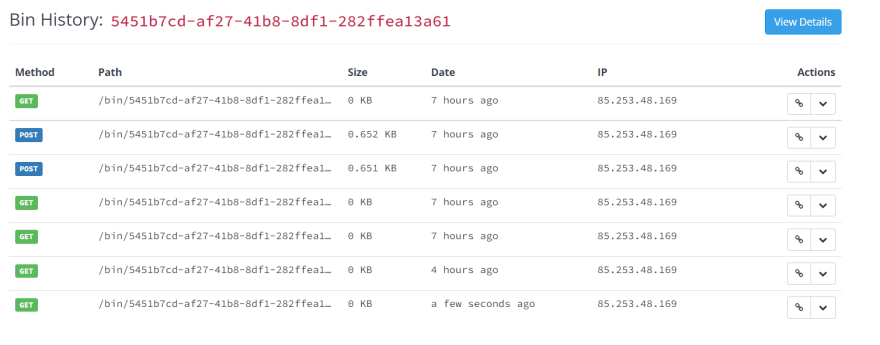
{"uri": "http://mockbin.org/bin/5451b7cd-af27-41b8-8df1-282ffea13a61"}Once we get a successful response from APISIX server, we can send a request to this get endpoint to generate logs.
curl -i http://127.0.0.1:9080/getThen if you click and navigate to the following mock server link some recent logs are sent and we can see them:
Metrics
Metrics are a numeric representation of data measured over intervals of time. You can also aggregate this data into daily or weekly frequency and run queries against a distributed system like Elasticsearch. Or sometimes based on metrics you trigger alerts to take any action later. Once API metrics are collected, you can track them with metrics tracking tools such as Prometheus.
Apache APISIX API Gateway also offers prometheus-plugin to fetch your API metrics and expose them in Prometheus. Behind the scene, Apache APISIX downloads the Grafana dashboard meta, imports it to Grafana, and fetches real-time metrics from the Prometheus plugin.
Let’s enable prometheus-plugin for our route:
    curl http://127.0.0.1:9080/apisix/admin/routes/1  -H 'X-API-KEY: edd1c9f034335f136f87ad84b625c8f1' -X PUT -d '
{
    "uri": "/get",
    "plugins": {
        "prometheus":{}
    },
    "upstream_id": "1"
}
We fetch the metric data from the specified URL /apisix/prometheus/metrics.
curl -i http://127.0.0.1:9091/apisix/prometheus/metricsYou will get a response with Prometheus metrics something like below:
HTTP/1.1 200 OK
Server: openresty
Date: Fri, 25 Mar 2022 11:13:14 GMT
Content-Type: text/plain; charset=utf-8
Transfer-Encoding: chunked
Connection: keep-alive
# HELP apisix_batch_process_entries batch process remaining entries
# TYPE apisix_batch_process_entries gauge
apisix_batch_process_entries{name="http logger",route_id="1",server_addr="172.19.0.8"} 0
# HELP apisix_etcd_modify_indexes Etcd modify index for APISIX keys
# TYPE apisix_etcd_modify_indexes gauge
apisix_etcd_modify_indexes{key="consumers"} 17819
apisix_etcd_modify_indexes{key="global_rules"} 17832
apisix_etcd_modify_indexes{key="max_modify_index"} 20028
apisix_etcd_modify_indexes{key="prev_index"} 18963
apisix_etcd_modify_indexes{key="protos"} 0
apisix_etcd_modify_indexes{key="routes"} 20028
...
And we can also check the status of our endpoint at the Prometheus dashboard by pointing to this URL http://localhost:9090/targets.
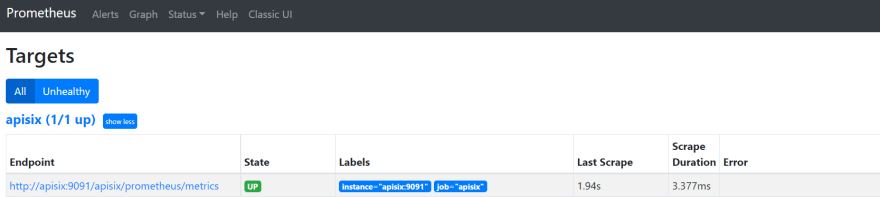
As you can see, Apache APISIX exposed metrics endpoint is upon and running.
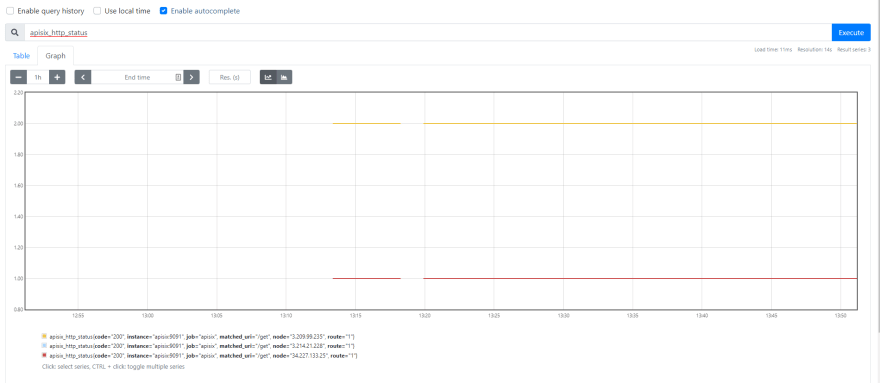
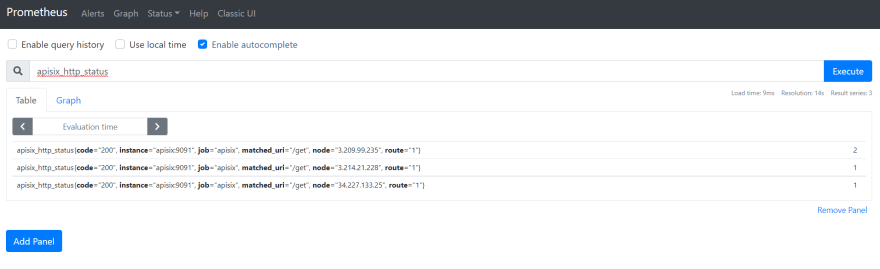
Now you can query metrics for apisix_http_status to see what HTTP requests are handled by API Gateway and what was the outcome.
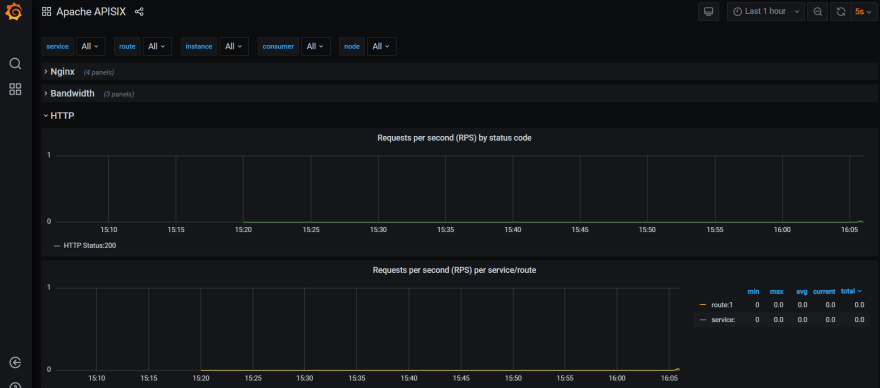
In addition to this, you can view the Grafana dashboard running in your local instance. Go to http://localhost:3000/
Tracing
The third is tracing or distributed tracing allows you to understand the life of a request as it traverses your service network and allows you to answer questions like what service has this request touched and how much latency was introduced. Traces enable you to further explore which logs to look at for a particular session or related set of API calls.
Zipkin, an open-source distributed tracing system. APISIX plugin is supported to collect tracing and report to Zipkin Collector based on Zipkin API specification.
Here’s an example to enable the zipkin plugin on the specified route:
curl http://127.0.0.1:9080/apisix/admin/routes/1  \
-H 'X-API-KEY: edd1c9f034335f136f87ad84b625c8f1' -X PUT -d '
{
    "methods": ["GET"],
    "uri": "/get",
    "plugins": {
        "zipkin": {
            "endpoint": "http://127.0.0.1:9411/api/v2/spans",
            "sample_ratio": 1
        }
    },
    "upstream_id": "1"
}'
We can test our example by simply running the following curl command:
curl -i http://127.0.0.1:9080/get
As you can see, there are some additional trace identifiers (like traceId, spanId, parentId) were appended to the headers:
"X-B3-Parentspanid": "61bd3f4046a800e7",
"X-B3-Sampled": "1",
"X-B3-Spanid": "855cd5465957f414",
"X-B3-Traceid": "e18985df47dab632d62083fd96626692",
Then you can use a browser to access http://127.0.0.1:9411/zipkin, see traces on the Web UI of Zipkin.
Note that you need to run the Zipkin instance in order to install Zipkin Web UI. For example, by using docker you can simply run it:
docker run -d -p 9411:9411 openzipkin/zipkin
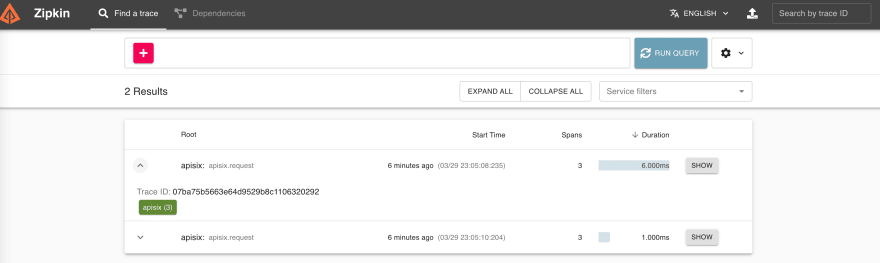
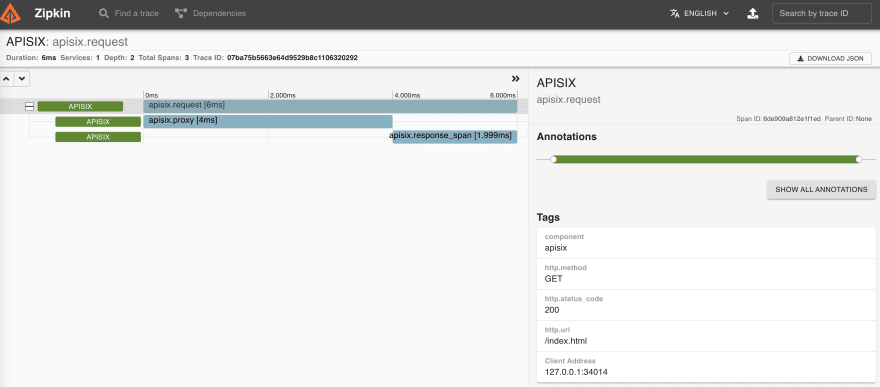
As you noticed, the recent traces were exposed in the above pictures.
Summary
As we learned, API Observability is a sort of framework for managing your applications in an API world and Apache APISIX API Gateway plugins can help when observing modern API-driven applications by integrating to several observability platforms. So, you can make your development work focused on core business features instead of building a custom integration for observability tools.
You can also click below to get more details:
- Download Apache APISIX
- Getting Started with Apache APISIX
- Getting Started with Apache APISIX Dashboard
- Overview of Apache APISIX Plugins
- Install Apache APISIX
- Watch the Video version of the blog post
If you have any questions, feel free to mail Apache APISIX Community