

本文介绍了如何使用 Prometheus 监控 APISIX Ingress Controller 的相关步骤和部分指标的展示效果。
无论是之前单体应用的时代,或是云原生大行其道的今天,「监控功能」一直扮演着十分重要的角色。一个良好的监控体系能够帮助工程师们快速了解运行在生产环境中的服务状态,并在服务异常时快速定位问题或者提前预警异常的发生。
Apache APISIX Ingress Controller 在最近几个版本中加强了对 Prometheus Metrics 的支持。本文将为大家介绍如何使用 Prometheus 收集 APISIX Ingress Controller 的 Metrics 数据,并通过 Grafana 进行后续可视化呈现。
步骤一:安装 APISIX Ingress Controller
首先我们通过 Helm 将 Apache APISIX、ETCD 和 APISIX Ingress Controller 部署到本地的 Kubernetes 集群中。
helm repo add apisix https://charts.apiseven.com
helm repo update
kubectl create namespace ingress-apisix
helm install apisix apisix/apisix --namespace ingress-apisix \
 --set ingress-controller.enabled=true
安装完毕后请等待,直至所有服务都已正常运行。具体状态确认可通过下述命令进行检查。
kubectl get all -n ingress-apisix
步骤二:启用 Prometheus 插件
大部分情况下,监控功能的涉及面肯定不止 APISIX Ingress Controller 这一个组件,如果需要同时监控 Apache APISIX,可以创建以下 ApisixClusterConfig 资源。
apiVersion: apisix.apache.org/v2alpha1
kind: ApisixClusterConfig
metadata:
  name: default
spec:
  monitoring:
    prometheus:
      enable: true
安装 Prometheus 和 Grafana
接下来我们将通过 Prometheus Operator 来启用 Prometheus 服务,因此需要先安装 Prometheus Operator。
注意
下述命令同时也会安装 Grafana
helm repo add prometheus-community https://prometheus-community.github.io/helm-charts
heml repo update
kubectl create namespace prometheus
helm install prometheus prometheus-community/kube-prometheus-stack -n prometheus
安装完毕后,需要准备 Prometheus 实例的 RBAC 配置。该配置可赋予 Prometheus 实例向 Kubernetes API Server 获取 Pod 和 Service 资源的能力。
apiVersion: v1
kind: ServiceAccount
metadata:
  name: ingress-apisix
  namespace: ingress-apisix
---
apiVersion: rbac.authorization.k8s.io/v1
kind: ClusterRole
metadata:
  name: ingress-apisix
rules:
- apiGroups: [""]
  resources:
  - nodes
  - nodes/metrics
  - services
  - endpoints
  - pods
  verbs: ["get", "list", "watch"]
- apiGroups: [""]
  resources:
  - configmaps
  verbs: ["get"]
- apiGroups:
  - networking.k8s.io
  resources:
  - ingresses
  verbs: ["get", "list", "watch"]
- nonResourceURLs: ["/metrics"]
  verbs: ["get"]
---
apiVersion: rbac.authorization.k8s.io/v1
kind: ClusterRoleBinding
metadata:
  name: ingress-apisix
roleRef:
  apiGroup: rbac.authorization.k8s.io
  kind: ClusterRole
  name: ingress-apisix
subjects:
- kind: ServiceAccount
  name: ingress-apisix
  namespace: ingress-apisix
完成上述实例配置后,需要定义 PodMonitor,也可以根据场景需求选择使用 ServiceMonior。下述 PodMonitor 资源将聚焦于 APISIX Ingress Controller Pod 的 Metrics 收集。
apiVersion: monitoring.coreos.com/v1
kind: PodMonitor
metadata:
  name: ingress-apisix
  namespace: ingress-apisix
  labels:
    use-for: ingress-apisix
spec:
  selector:
    matchLabels:
      app.kubernetes.io/name: ingress-controller
  podMetricsEndpoints:
  - port: http
额外说明
这里不使用 ServiceMonitor 的原因是 http 这一端口没有暴露到 Service 级别。
最后可通过下述指令进行 Prometheus 实例的定义。
apiVersion: monitoring.coreos.com/v1
kind: Prometheus
metadata:
  name: ingress-apisix
  namespace: ingress-apisix
spec:
  serviceAccountName: ingress-apisix
  podMonitorSelector:
    matchLabels:
      use-for: ingress-apisix
  resources:
    requests:
      memory: 400Mi
  enableAdminAPI: false
  image: prom/prometheus:v2.31.0
将上述资源全部应用到 Kubernetes 集群后,等待相关组件就绪。
步骤三:配置 Grafana
接下来我们通过配置 Grafana 进行可视化呈现。
首先访问 prometheus-grafana 服务。注意,如果没有暴露 Service 到集群外部的手段,可以尝试使用端口转发的方式,Grafana 的管理员用户名和密码保存在 prometheus-grafana 这一 Secret 中。
打开 Grafana 后,导入 APISIX Ingress Controller 的 Dashboard 模版即可看到监控大盘,效果图如下:
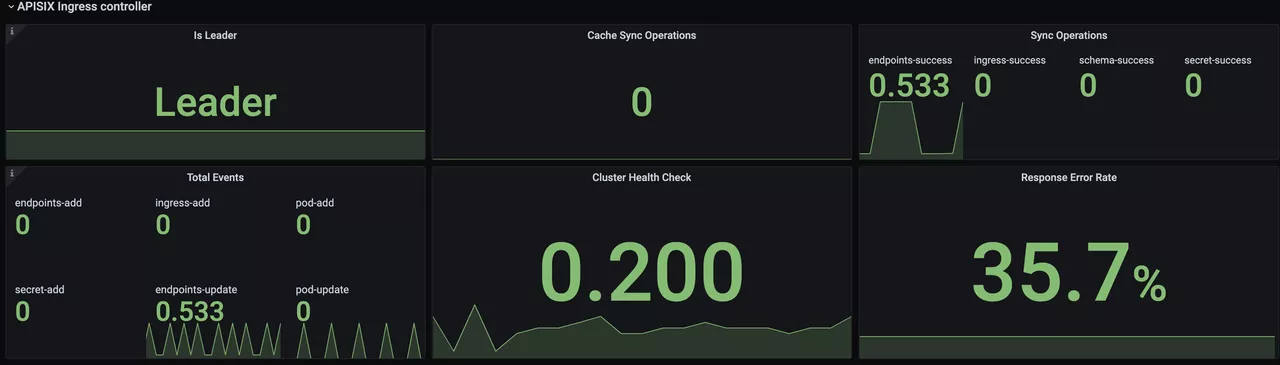

补充:监控指标释义
目前 APISIX Ingress Controller 的监控指标聚焦于它和数据面 Apache APISIX 实例的交互(配置下发)上,包括配置同步的数量与延迟等相关数据。
is_leader:当前 APISIX Ingress Controller 实例是否为 Leader 角色。同一组 APISIX Ingress Controller 只会有一个 Leader,其余实例均为 Candidate。sync_operations:包括 APISIX Ingress Controller 向数据面同步配置时的一些指标,包括推送次数、失败率、延迟等。通过这类指标可以监控配置下发是否正常,以此来帮助研发和运维同学进行监控预警和故障定位。
总结
本文介绍了如何使用 Prometheus 监控 APISIX Ingress Controller 的相关步骤和部分指标的展示效果。目前只包含了一些基本的监控指标,我们会在后续继续进行打磨和升级,增加更多的指标项和集成数据面 APISIX 的指标,为大家带来更好的监控体验。
当然也欢迎感兴趣的朋友参与 Apache APISIX Ingress Controller 项目的代码贡献中来,期待我们一起将 APISIX Ingress Controller 打造地更加全面化。