
Apache APISIX recently released a new plugin: APISIX-Datadog, to provide a deeper integration with Datadog. This article introduces the APISIX-Datadog Plugin and its capabilities.

As the complexity of IT products and consumer-facing application development increases, monitoring becomes an integral part of any application delivery. Additionally, to meet the endless demand of rapid upgrade cycles while ensuring stability, streamlined performance and keeping a perfect balance between service level indicators (SLI) with Service-level objectives (SLO) and Service-level agreement (SLA) - effective monitoring is immensely important.
As a Cloud API Management Product, Apache APISIX decouples observability concerns from the application, which gives the developers an advantage of building applications focusing just on the business logic while Apache APISIX will take care of observability for the platform of their choice.
Apache APISIX recently released a new plugin: APISIX-Datadog, to provide a deeper integration with Datadog. This article introduces the APISIX-Datadog Plugin and its capabilities.
How APISIX-Datadog plugin works
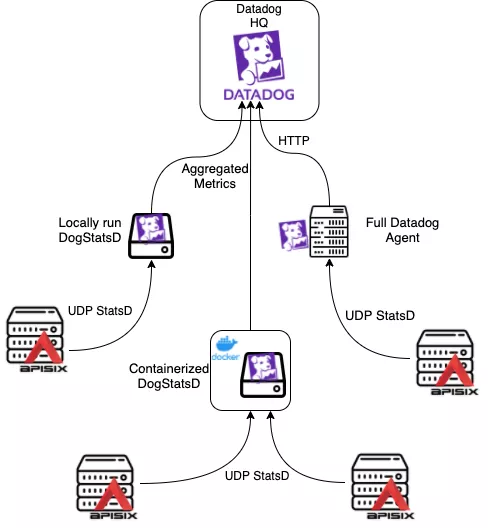
The APISIX-Datadog plugin pushes its custom metrics to the DogStatsD server, comes bundled with Datadog agent over the UDP connection. DogStatsD basically is an implementation of StatsD protocol. It collects the custom metrics for Apache APISIX agent, aggregates it into a single data point and sends it to the configured Datadog server. To learn more about DogStatsD, please visit DogStatsD documentation.
When APISIX-Datadog is activated, Apache APISIX agent exports the following metrics to DogStatsD server for every request response cycle:
| Metric Name | StatsD Type | Description |
|---|---|---|
| Request Counter | Counter | Number of requests received. |
| Request Latency | Histogram | Time taken to process the request (in milliseconds). |
| Upstream latency | Histogram | Time taken since proxying the request to the upstream server till a response is received (in milliseconds). |
| APISIX Latency | Histogram | Time taken by APISIX agent to process the request (in milliseconds). |
| Ingress Size | Timer | Request body size in bytes. |
| Egress Size | Timer | Response body size in bytes. |
The metrics will be sent to the DogStatsD agent with the following tags. If there is no suitable value for any particular tag, the tag will simply be omitted.
| Metric Name | Description |
|---|---|
| route_name | Name specified in the route schema definition. If not present, it will fall back to the route id value. |
| service_id | If a route has been created with the abstraction of service, the particular service id will be used. |
| consumer | If the route has a linked consumer, the consumer Username will be added as a tag. |
| balancer_ip | IP of the Upstream balancer that has processed the current request. |
| response_status | HTTP response status code. |
| scheme | Scheme that has been used to make requests, such as HTTP, gRPC, gRPCs etc. |
The plugin maintains a buffer with a timer. When the timer expires, APISIX-Datadog plugin flashes the buffered metrics as a batch to the locally run dogstatsd server. This approach is less resource-hungry (though it might be insignificant as UDP sockets are very lightweight) by reusing the same UDP socket and doesn't overload the network all the time as the timer can be configured.
Steps to Run Datadog Agent
- If you are already using Datadog inside your infrastructure, you must have a datadog agent installed in your systems. It may either be a docker container, pod or binary for a respective package manager. In this case, you are good to go. Just make sure port 8125/udp is allowed through the firewall (if any) i.e more specifically, the Apache APISIX agent can reach port 8125 of the datadog agent. You may skip this subsection.
To learn more about how to install a full-fledged datadog agent, visit here.
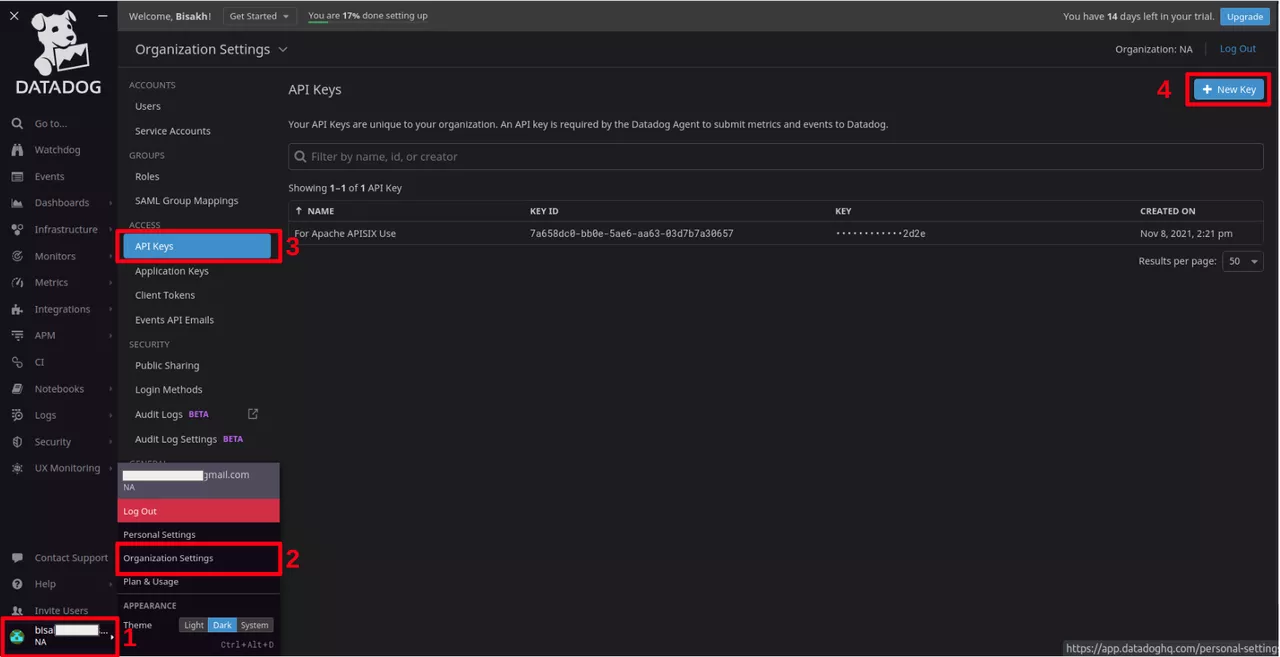
If you are new to Datadog
- First create an account by visiting www.datadoghq.com.
- Generate an API Key.
 Click to Preview
APISIX-Datadog plugin requires only the dogstatsd component of
datadog/agentas the plugin asynchronously send metrics to the dogstatsd server following the statsd protocol over standard UDP socket. That's why APISIX recommends using the standalonedatadog/dogstatsdimage instead of using the full agent. It's extremely lightweight (only ~11 MB in size) compared to ~2.8GB ofdatadog/agentimage.

To run it as a container:
# pull the latest image
docker pull datadog/dogstatsd:latest
# run a detached container
docker run -d --name dogstatsd-agent -e DD_API_KEY=<Your API Key from step 2> -p 8125:8125/udp  datadog/dogstatsd
If you are using Kubernetes in your production environment, you can deploy dogstatsd as a Daemonset or as a Multi-Container Pod alongside Apache APISIX agent.
How to Use Datadog with Apache APISIX
Activate the APISIX-Datadog plugin
The following is an example on how to activate the datadog plugin for a specific route. We are assuming your dogstatsd agent is already up an running.
# enable plugin for a specific route
curl http://127.0.0.1:9080/apisix/admin/routes/1 -H 'X-API-KEY: edd1c9f034335f136f87ad84b625c8f1' -X PUT -d '
{
    "plugins": {
        "datadog": {}
    },
    "upstream": {
        "type": "roundrobin",
        "nodes": {
            "127.0.0.1:1980": 1
        }
    },
    "uri": "/hello"
}'
Now any requests to endpoint uri /hello will generate the above metrics and push it to local DogStatsD server of the datadog agent.
Custom Configuration
In default configuration, the plugin expects the dogstatsd service to be available at 127.0.0.1:8125. If you wish to update the config, please update the plugin metadata:
Metadata Schema
| Name | Type | Required | Default | Description |
|---|---|---|---|---|
| hosts | string | optional | "127.0.0.1" | The DogStatsD server host address |
| port | integer | optional | 8125 | The DogStatsD server host port |
| namespace | string | optional | "apisix" | Prefix for all the custom metrics sent by APISIX agent. Useful for finding entities for metric graph. e.g. (apisix.request.counter) |
| constant_tags | array | optional | ["source:apisix"] | Static tags embedded into generated metrics. Useful for grouping metric over certain signals. |
To know more about how to effectively write tags, please visit here
Make a request to /apisix/admin/plugin_metadata endpoint with the updated metadata as following:
curl http://127.0.0.1:9080/apisix/admin/plugin_metadata/datadog -H 'X-API-KEY: edd1c9f034335f136f87ad84b625c8f1' -X PUT -d '
{
    "host": "127.0.0.1",
    "port": 8125,
    "constant_tags": [
        "source:apisix",
        "service:custom"
    ],
    "namespace": "apisix"
}'
Plugin Schema
Similarly, there are few attributes that can be tweaked while enabling the plugin.
| Name | Type | Required | Default | Valid | Description |
|---|---|---|---|---|---|
| batch_max_size | integer | optional | 5000 | [1,...] | Max buffer size of each batch |
| inactive_timeout | integer | optional | 5 | [1,...] | Maximum age in seconds when the buffer will be flushed if inactive |
| buffer_duration | integer | optional | 60 | [1,...] | Maximum age in seconds of the oldest entry in a batch before the batch must be processed |
| max_retry_count | integer | optional | 1 | [1,...] | Maximum number of retries if one entry fails to reach dogstatsd server |
As all the fields are optional and if no attributes are set, the datadog plugin gets instantiated with the default values. To update any attribute, just update the required route, service or consumer with the updated attribute value. For example, the code below modifies the maximum buffer size of each batch:
'{
...
"plugins": {
    "datadog": {
        "batch_max_size": 10
    }
}
... }'
Deactivate the APISIX-Datadog plugin
Now, to deactivate the plugin, simply remove the corresponding json configuration in the plugin configuration to disable the datadog. APISIX plugins are hot-reloaded, therefore no need to restart APISIX.
# disable plugin for a route
curl http://127.0.0.1:9080/apisix/admin/routes/1 -H 'X-API-KEY: edd1c9f034335f136f87ad84b625c8f1' -X PUT -d '
{
    "uri": "/hello",
    "plugins": {},
    "upstream": {
        "type": "roundrobin",
        "nodes": {
            "127.0.0.1:1980": 1
        }
    }
}'