

This article introduces you to the Apache APISIX
opentelemetryplugin concept and how to enable and deploy theopentelemetryplugin.
Background Information
Apache APISIX is a dynamic, real-time, high-performance API gateway that provides rich traffic management features such as load balancing, dynamic upstream, canary release, circuit breaking, authentication, observability, and more. It not only has many useful plugins, but also supports plugin dynamic change and hot swap.
OpenTelemetry is an open source telemetry data acquisition and processing system. It not only provides various SDKS for application side telemetry data collection and reporting, but also data collection side for data receiving, processing and exporting. Export to any or more OpenTelemetry backends, such as Jaeger, Zipkin, and OpenCensus, by configuration. You can view the list of plug-ins that have adapted the OpenTelemetry Collector in the opentelemetry collector contrib library.

Plugin Introduction
The opentelemetry plugin of Apache APISIX implements Tracing data collection based on OpenTelemetry native standard (OTLP/HTTP), and sends it to OpenTelemetry Collector through HTTP protocol. This feature will be supported online in Apache APISIX 2.13.0.
Since the Agent/SDK of OpenTelemetry has nothing to do with the back-end implementation, when the application integrates the Agent/SDK of OpenTelemetry, the user can easily and freely change the observability backend service without any perception on the application side, such as switching from Zipkin into Jaeger.
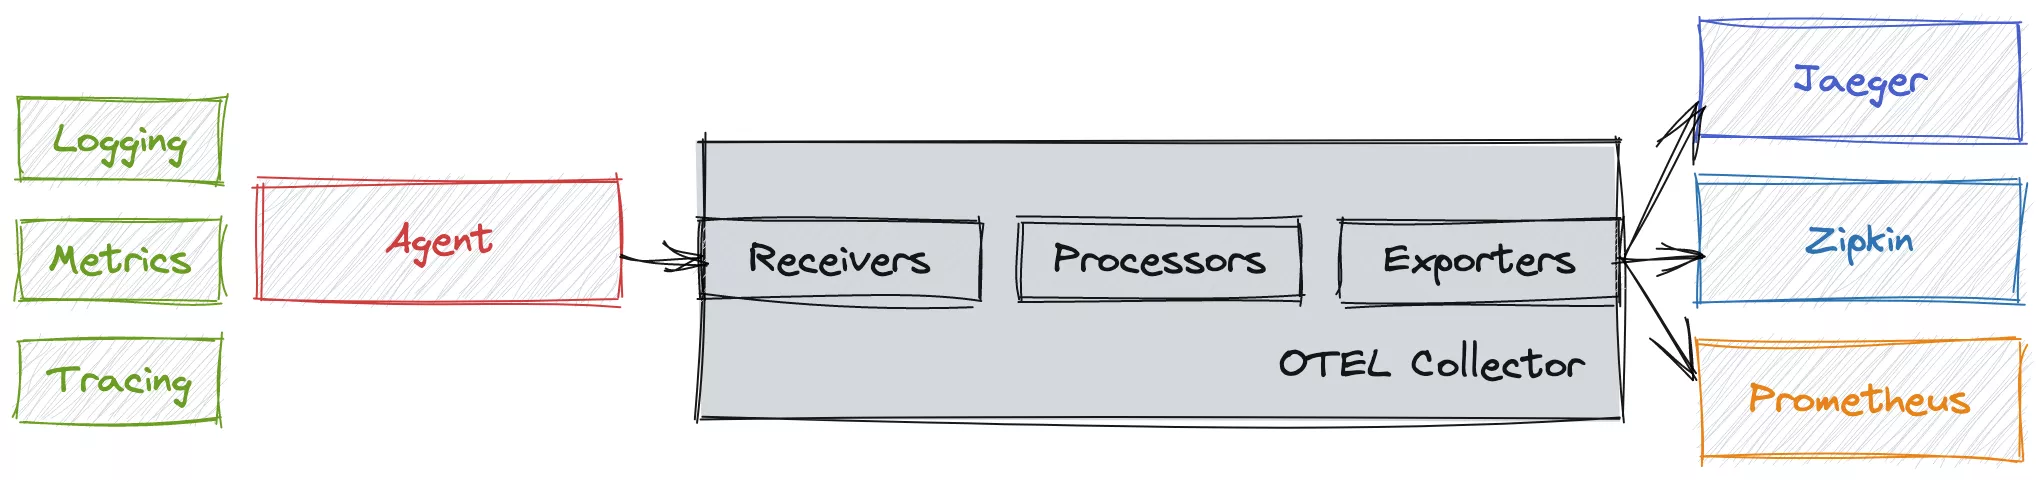
The opentelemetryplug-in integrates the OpenTelemetry Agent/SDK in Apache APISIX, which can collect traced requests, generate trace and forward them to the OpenTelemetry Collector.
The opentelemetry plugin is located on the Agent side in the above figure, but currently only supports the trace part, and does not support the logs and metrics protocols of OpenTelemetry.
How to Use
Enable Plugin
You need to enable opentelemetry plugin and modify collector configuration in conf/config.yaml configuration file.
It is assumed that you have already deployed the OpenTelemetry Collector and enabled the OTLP HTTP Receiver.
If you have not completed the deployment, you can refer to the Scenario Example section in the next section to complete the deployment of OpenTelemetry Collector.
The default port of the OTLP HTTP Receiver is 4318, and the address of collector is the HTTP Receiver address of the OpenTelemetry Collector. For related fields, please refer to the Apache APISIX official documentation.
plugins
... # Other plugins that have been enabled
- opentelemetry
plugin_attr:
...
opentelemetry:
  trace_id_source: x-request-id
  resource:
    service.name: APISIX
  collector:
    address: 127.0.0.1:4318 # OTLP HTTP Receiver address
    request_timeout: 3
Method 1: Bind the plugin to the specified route
In order to show the test effect more conveniently, sampler is temporarily set to full sampling in the example to ensure that trace data is generated after each request is traced, so that you can view trace related data on the Web UI. You can also set relevant parameters according to the actual situation.
curl http://127.0.0.1:9080/apisix/admin/routes/1 \
-H 'X-API-KEY: edd1c9f034335f136f87ad84b625c8f1' \
-X PUT -d '
{
  "uri": "/get",
  "plugins": {
      "opentelemetry": {
          "sampler": {
              "name": "always_on"
          }
      }
  },
  "upstream": {
      "type": "roundrobin",
      "nodes": {
          "httpbin.org:80": 1
      }
  }
}'
Method 2: Set Global Rules
You can also enable opentelemetry plugin through the Apache APISIX Plugins feature. After the global configuration is complete, you still need to create the route, otherwise it will not be possible to test.
curl 'http://127.0.0.1:9080/apisix/admin/global_rules/1' \
-H 'X-API-KEY:  edd1c9f034335f136f87ad84b625c8f1' \
-X PUT -d '{
  "plugins": {
      "opentelemetry": {
          "sampler": {
              "name": "always_on"
          }
      }
  }
}'
Method 3: Customize labels for Span through additional_attributes
For the configuration of sampler and additional_attributes, you can refer to the Apache APISIX official documentation, where additional_attributes is a series of Key:Value key value pairs, you can use it to customize the label for Span, and can follow Span to display on the Web UI. Add route_id and http_x-custom-ot-key to the span of a route through additional_attributes, you can refer to the following configuration:
curl http://127.0.0.1:9080/apisix/admin/routes/1001 \
-H 'X-API-KEY: edd1c9f034335f136f87ad84b625c8f1' \
-X PUT -d '
{
  "uri": "/put",
  "plugins": {
      "opentelemetry": {
          "sampler": {
              "name": "always_on"
          },
          "additional_attributes":[
              "route_id",
              "http_x-custom-ot-key"
          ]
      }
  },
  "upstream": {
      "type": "roundrobin",
      "nodes": {
          "httpbin.org:80": 1
      }
  }
}'
Test Example
You can enable opentelemetry plugin in any of the above three methods. The following example uses the example of method three to create a route. After the creation is successful, you can refer to the following commands to access the route:
curl -X PUT -H `x-custom-ot-key: test-ot-val` http://127.0.0.1:9080/put
After the access is successful, you can see the details of the span similar to /put in the Jaeger UI, and you can see that the custom tags in the route are displayed in the Tags list: http_x-custom-ot-key and route_id.
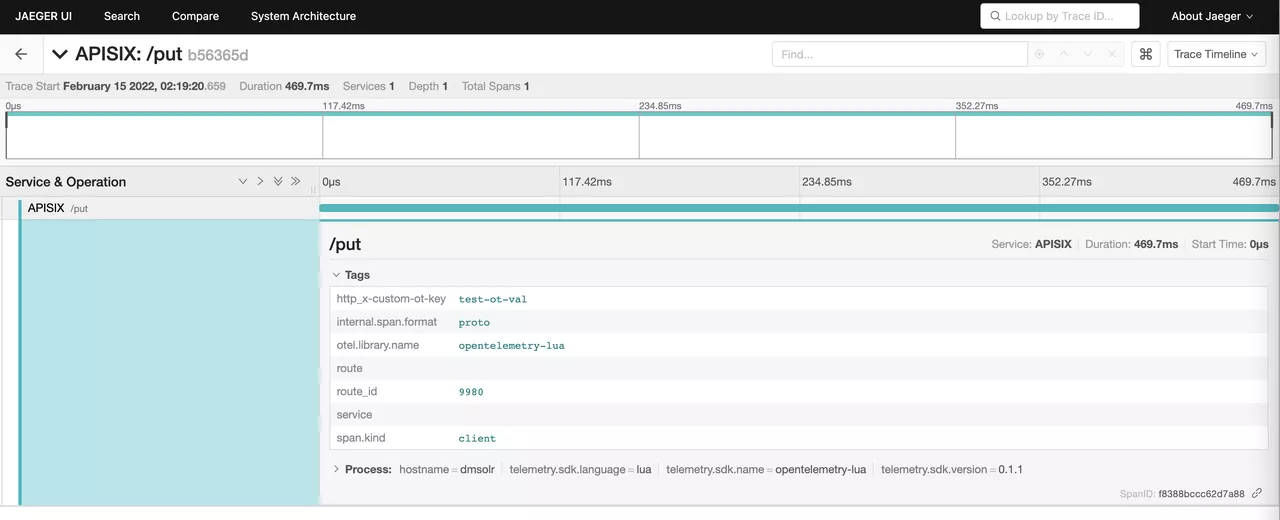
You need to note that the additional_attributes configuration is set to take values from Apache APISIX and Nginx variables as attribute values, so additional_attributes must be a valid Apache APISIX or Nginx variable. It also includes HTTP Header, but when fetching http_header, you need to add http_ as the prefix of the variable name. If the variable does not exist, the tag will not be displayed.
Scenario Example
This scenario example deploys Collector, Jaeger, and Zipkin as backend services by simply modifying the official example of OpenTelemetry Collector, and starts two sample applications (Client and Server), where Server provides an HTTP service, and Client will cyclically call the server provided by the server. HTTP interface, resulting in a call chain consisting of two spans.
Step 1: Deploy OpenTelemetry
The following uses docker-compose as an example. For other deployments, please refer to the OpenTelemetry official documentation.
You can refer to the following command to deploy:
git clone https://github.com/open-telemetry/opentelemetry-collector-contrib.git
cd opentelemetry-collector-contrib/examples/demo
docker-compose up -d
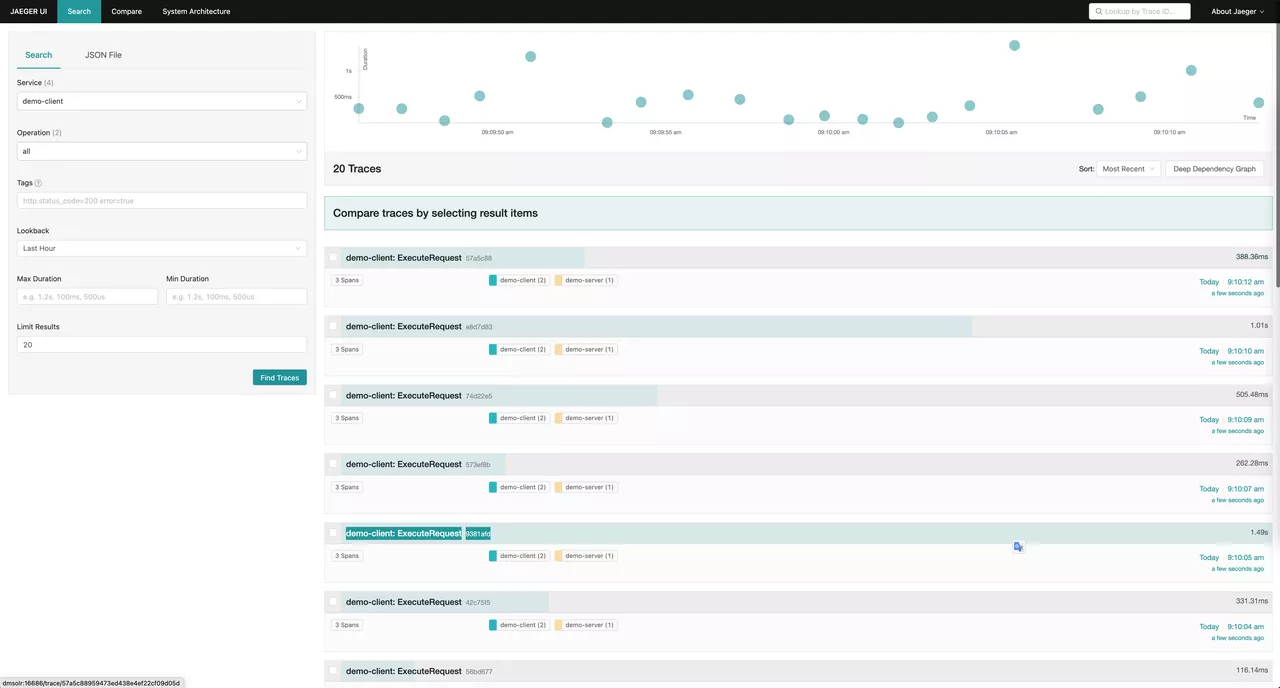
Enter http://127.0.0.1:16886 (Jaeger UI) or http://127.0.0.1:9411/zipkin (Zipkin UI) in the browser. If it can be accessed normally, the deployment is successful.
The following figure shows an example of successful access:


Step 2: Configure the Test Environment
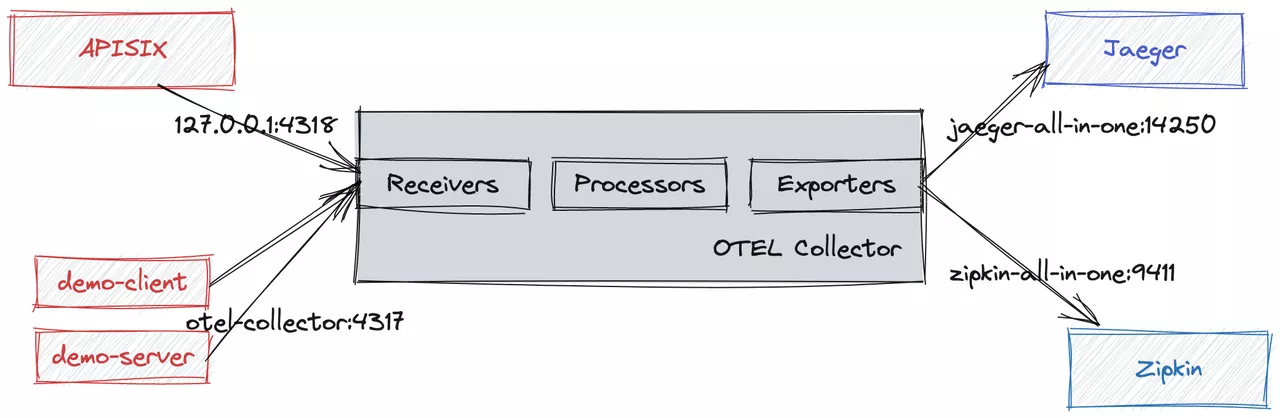
The Apache APISIX service is introduced, and the topology of the final application is shown in the following figure:


The Trace data reporting process is as follows. Among them, since Apache APISIX is deployed separately and not in the network of docker-compose, Apache APISIX accesses the OTLP HTTP Receiver of OpenTelemetry Collector through the locally mapped port (127.0.0.1:4138).
You need to make sure you have enabled the opentelemetry plugin and reload Apache APISIX.
You can refer to the following example to create a route and enable the
opentelemetryplugin for sampling:curl http://127.0.0.1:9080/apisix/admin/routes/1 \
-H 'X-API-KEY: edd1c9f034335f136f87ad84b625c8f1' \
-X PUT -d '
{
"uri": "/hello",
"plugins": {
"opentelemetry": {
"sampler": {
"name": "always_on",
}
}
},
"upstream": {
"type": "roundrobin",
"nodes": {
"127.0.0.1:7080": 1
}
}
}'Modify the
./examples/demo/otel-collector-config.yamlfile and add the OTLP HTTP Receiver as follows:receivers:
otlp:
protocols:
grpc:
http:${ip:port} # add OTLP HTTP Receiver,default port is 4318Modify
docker-compose.yaml.
You need to modify the configuration file, change the interface address of Client calling Server to the address of Apache APISIX, and map the ports of OTLP HTTP Receiver and Server services to local.
The following example is the complete docker-compose.yaml after the configuration is modified:
version: "2"
services:

# Jaeger
jaeger-all-in-one:
  image: jaegertracing/all-in-one:latest
  ports:
    - "16686:16686" # jaeger ui port
    - "14268"
    - "14250"

# Zipkin
zipkin-all-in-one:
  image: openzipkin/zipkin:latest
  ports:
    - "9411:9411"

# Collector
otel-collector:
  image: ${OTELCOL_IMG}
  command: ["--config=/etc/otel-collector-config.yaml", "${OTELCOL_ARGS}"]
  volumes:
    - ./otel-collector-config.yaml:/etc/otel-collector-config.yaml
  ports:
    - "1888:1888"   # pprof extension
    - "8888:8888"   # Prometheus metrics exposed by the collector
    - "8889:8889"   # Prometheus exporter metrics
    - "13133:13133" # health_check extension
    - "4317"        # OTLP gRPC receiver
    - "4318:4318"   # Add OTLP HTTP Receiver port mapping
    - "55670:55679" # zpages extension
  depends_on:
    - jaeger-all-in-one
    - zipkin-all-in-one

demo-client:
  build:
    dockerfile: Dockerfile
    context: ./client
  environment:
    - OTEL_EXPORTER_OTLP_ENDPOINT=otel-collector:4317
    - DEMO_SERVER_ENDPOINT=http://172.17.0.1:9080/hello # APISIX address
  depends_on:
    - demo-server

demo-server:
  build:
    dockerfile: Dockerfile
    context: ./server
  environment:
    - OTEL_EXPORTER_OTLP_ENDPOINT=otel-collector:4317
  ports:
    - "7080:7080" # Map the Server port to the host
  depends_on:
    - otel-collector

prometheus:
  container_name: prometheus
  image: prom/prometheus:latest
  volumes:
    - ./prometheus.yaml:/etc/prometheus/prometheus.yml
  ports:
    - "9090:9090"
It should be noted that demo-client.environment.DEMO_SERVER_ENDPOINT needs to be changed to your Apache APISIX address, and ensure that it can be accessed normally in the container.
Of course, you can also deploy Apache APISIX through docker-compose.yaml. For details, please refer to the Apache APISIX official documentation.
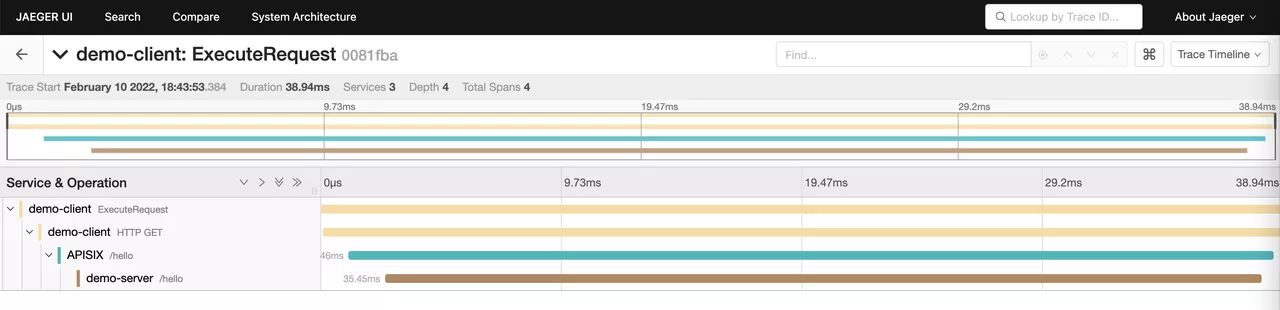
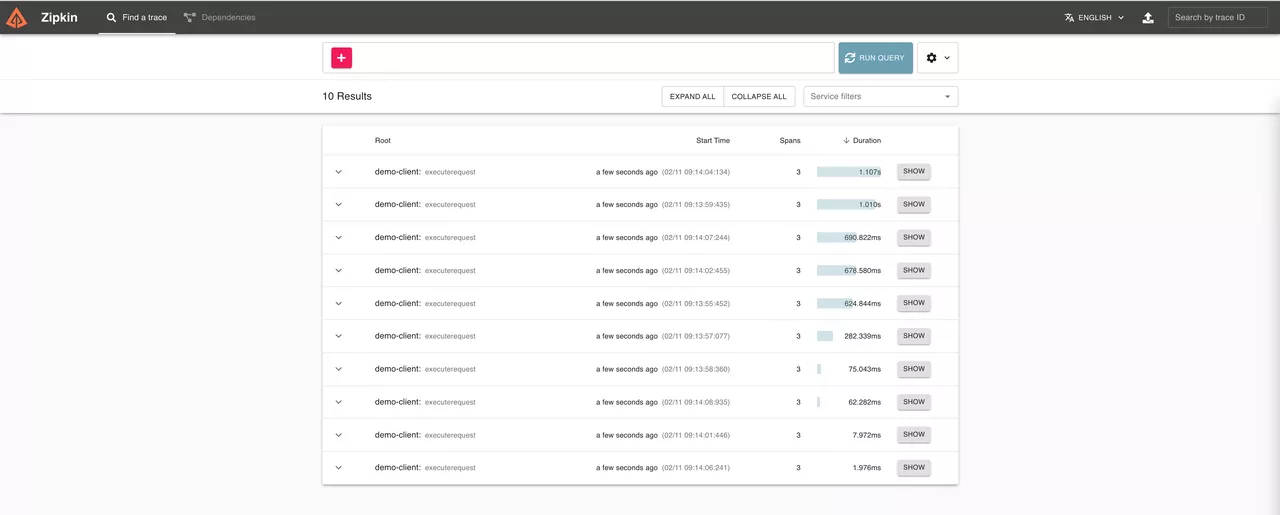
Step 3: Test
After the redeployment is completed, you can access the Jaeger UI or Zipkin UI to see that the Span of APISIX is included in the Trace, as shown below:


Disable Plugin
If you do not need trace collection of a route temporarily, you only need to modify the route configuration and delete the related configuration of opentelemetry under plugins in the configuration.
You can only remove the configuration of the opentelemetry global plugin if you enabled it globally by binding Global Rules.
Summary
After Apache APISIX integrates OpenTelemetry, it can easily connect with most mainstream Trace systems on the market with the help of OpenTelemetry's rich plug-ins. In addition, Apache APISIX has also implemented SkyWalking and Zipkin native standard protocol plug-ins, and is also actively cooperating with major communities to create a more powerful ecosystem.
Apache APISIX is also currently working on additional plugins to support integration with more services, so if you're interested, feel free to start a discussion thread in our GitHub Discussion or communicate via the mailing list.