
This article mainly introduces how to upload the APISIX indicator data to the DATA ANT monitoring system through the DataAnt Agent.
Background
Apache APISIX is an open source cloud native API gateway. As an API gateway, it has the characteristics of dynamic, real-time, and high performance. It provides rich traffic management functions such as load balancing, dynamic upstream, grayscale publishing, service fusing, identity authentication and observability. You can use APISIX to handle the traditional north-south traffic and the east-west traffic between services. It can also be used as a K8s ingress controller. Thanks to the full dynamic design of APISIX, configuration changes can be made at any time without restarting the service.
The DataAnt full-stack cloud monitoring system can aggregate all the operation and maintenance data of IaaS, PaaS and SaaS layers through big data and machine learning, and provide users with a unified visual interface. DataAnt allows users to move seamlessly and quickly between relevant monitoring data sources without having to switch tools and gain more granular visibility into the state of their IT systems. The DataAnt Agent it provides can monitor APISIX in real time and upload its monitoring data to the DataAnt PaSS platform to realize one-stop cloud monitoring.
Introduction

Collection configuration
The DataAnt Agent will first initialize and register the collector through the APISIX item in
config.yaml. The same Agent can register multiple collectors. After the collector collects the indicators exposed by APISIX, it encrypts the indicator data and uploads it to DataAnt Cloud.Data visualization
After DataAnt Cloud receives the data, the data will be stored in the time series database after preliminary monitoring information supplementation and processing, and then APISIX can be monitored in real time through DataAnt's Dashboard.
Alarm notification
The data will also be distributed to the alarm matching processing through the message, and then the notification aggregation will be carried out. Finally, the alarm will be sent through the configured notification method, that is, the abnormal situation of APISIX can be received in real time.
Operation steps
First, you need to access DataAnt Cloud, register an account and log in to the platform.
Obtain the Agent of DataAnt through the download link. After the download is complete, upload it to the machine where APISIX is located and add execution permission to the Agent.
Create the configuration file
./config.yamlrequired by DataAnt Agent in the current directory. The detailed configuration is as follows:tenantId: 11
hostIp: 127.0.0.1
hostName: apisix
configs:
- uri: http://127.0.0.1:9091
type: apisix
asName: apisix_testStart the Agent using the following command.。
./agentAfter successful startup, the following data will be returned:
2022/06/21 20:50:10 {"code":200,"msg":"请求成功","data":null}
2022/06/21 20:50:30 {"code":200,"msg":"请求成功","data":null}
2022-06-21 20:51:00:000        INFO        apisix/apisix.go:25        获取对应监控数据,数据长度1675
2022-06-21 20:51:00:000        INFO        prometheus/prometheusCollector.go:43        获取对应监控数据开始解析1675
2022-06-21 20:51:00:000        INFO        prometheus/prometheusCollector.go:43        获取对应监控数据完成解析 解析指标数量21
2022-06-21 20:51:00:000        INFO        collector/collector.go:82        apisix采集到数据数量21
2022-06-21 20:51:00:000 INFO runtime/asm_amd64.s:1581 apisix_test9091:指标数:21On the home page of the DataAnt platform, click
Install Integration Plugin>Monitoring Plugin, select APISIX and clickClick to configureunderConfiguration.On the homepage of the DataAnt platform, click
Dashboardin the left navigation bar and create a new dashboard. Select the indicators you need and drag them to the dashboard. The configured indicators are as follows: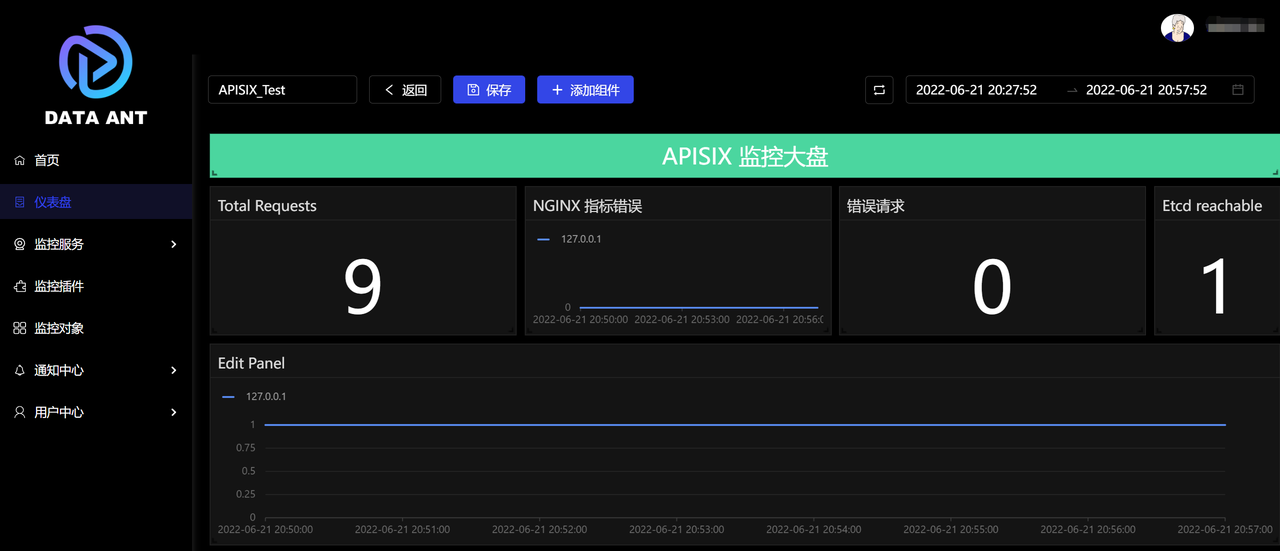 Click to Preview
note
DataAnt Agent will report data every 30 seconds, so there will be a certain delay.
Summary
This article mainly introduces how to upload APISIX index data to the DataAnt monitoring system through DataAnt Agent. You can use it later to configure relevant alarm rules and alarm contacts. When the service fails, you can be notified in time.