
APISIX Throughput Regression: Beyond the Flame Graph
On this page
- 1. Confirm the Worker Is CPU-Bound
- 2. Read Width, Not Rank
- 3. How a 3.0% Lua Self-Time Share Gets Amplified
- 4. When the Flame Graph Cannot Explain the Gap, Check LuaJIT
- 4.1 Interpreter Dispatch Was Abnormally Active
- 4.2 What jit.v Revealed—and Why We Misread It
- 4.3 Correlate start, stop, and abort by Trace Start
- 5. Use Paired A/B Tests to Measure the Impact
- References
The flame graph didn’t lie, but it didn’t explain the full throughput drop either. In this APISIX regression, two additional paths worth investigating had Lua self-time shares of only 3.0% and 3.9% among samples with Lua context.
If we had ranked hotspots by size alone, neither path would have been investigated first. We found them by following a sequence of checks: confirm that the worker is CPU-bound, compare flame-graph widths, follow repeated call paths, inspect LuaJIT compilation and aborts when the flame graph does not explain the end-to-end throughput gap, then use per-request call counts and paired A/B tests to measure the impact.
Data scope: The data below comes from one internally customized APISIX build in the same controlled environment, with more than 100 plugins loaded. Throughput is normalized and shown only to explain how we isolated the cause. It does not represent the general performance of Apache APISIX OSS under other hardware, configurations, or workloads.
1. Confirm the Worker Is CPU-Bound
A flame graph shows where the CPU spent its sampled time. Its width can explain a throughput drop only when the target worker is close to saturation and that core is the bottleneck.
Before collecting the profile, we held the following conditions constant:
- APISIX ran with a single worker pinned to a dedicated physical core.
- The upstream service and load generator ran on other cores to avoid CPU contention.
- The request model, configuration, and response content remained unchanged.
- The regression reproduced consistently. Error rates and responses did not drift.
- The target worker remained close to saturation, while the upstream service, network, and load generator still had headroom.
If any of these conditions is not met, start with connections, the network, the upstream service, or the load generator—not an on-CPU flame graph.
2. Read Width, Not Rank
We used eBPF to sample C and Lua call stacks simultaneously at 500 Hz. Here is the Lua on-CPU flame graph from the investigation.
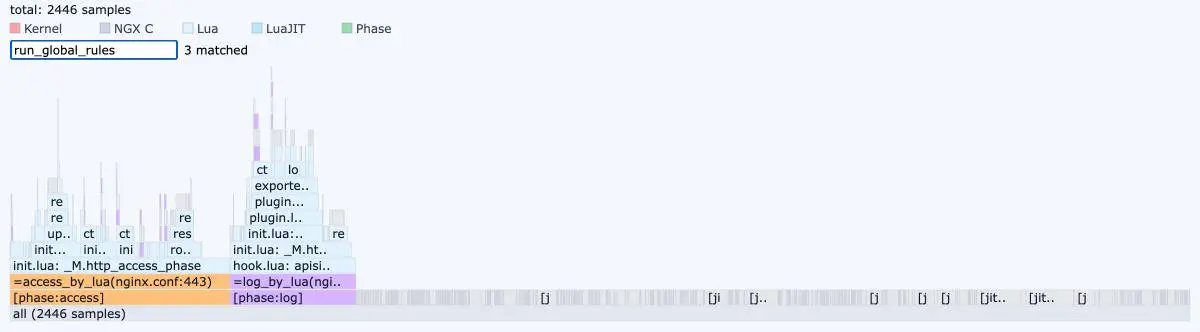
Figure 1: Full view of the Lua on-CPU flame graph. Searching for run_global_rules produced 3 matches, none of which stood out in the full graph. The original profile contained 2,446 samples; process PIDs were removed from the screenshot.
In a flame graph, x-axis position does not imply order. Width reflects how many samples landed on a path. Ranked by Lua self time, the initial candidates were:
| Candidate location | Lua self time | Initial assessment |
|---|---|---|
| Prometheus exporter | 25.9% | Highest-priority candidate |
ctx.var metamethod | 15.1% | Second candidate |
| Custom logging bypass | 3.9% | Easy to overlook |
run_global_rules | 3.0% | Easy to overlook |
Here, self time is the share of samples with Lua context that landed directly at a location—not a share of total CPU time. About 19.6% of the samples lacked Lua context, so these percentages are useful for selecting candidates, not predicting throughput gains.
This ranking has four blind spots:
- When LuaJIT executes interpreted code, different Lua code paths may collapse into shared
lj_BC_*andlj_vm_*symbols. - Compiled JIT traces cannot always be fully expanded by conventional stack unwinding, so observable JIT samples provide only a lower bound.
- Costs such as table lookups, memory allocation, and garbage collection are attributed to C symbols rather than to the Lua lines that triggered them.
- A call can change the caller’s JIT state, making the resulting cost appear at the caller’s function entry.
There was another clue: run_global_rules did not appear as one obvious hotspot. It appeared across stacks from several request phases. No single occurrence was wide, but the combined cost could still be substantial.
3. How a 3.0% Lua Self-Time Share Gets Amplified
When we selected a run_global_rules frame and followed the stack upward, we saw the request-phase entry point at the bottom, followed by common_phase, Global Rule plugin filtering, dispatch, and finally individual plugin execution.
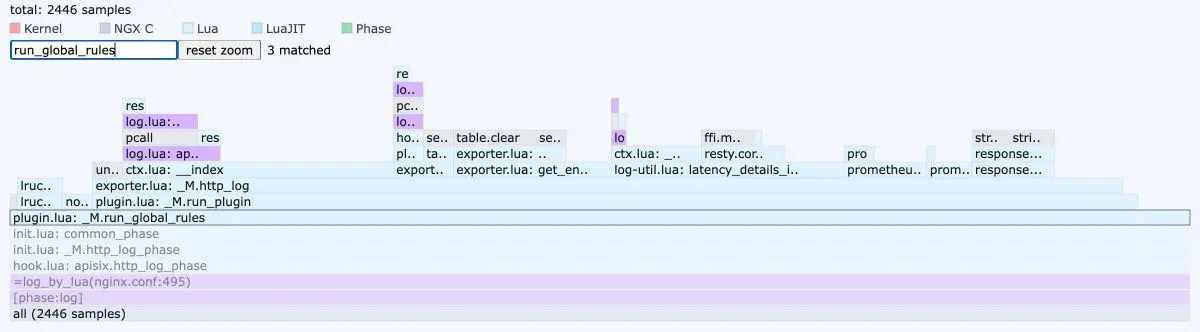
Figure 2: Interactive zoomed view after selecting one run_global_rules stack. The selected stack is stretched to fill the canvas, so its width is normalized and must not be interpreted as its share of total CPU time. Click the image to view it at full size.
Stack height does not represent elapsed time. It shows where the cost enters, who invokes it, and why the path executes repeatedly.
Before the fix, run_global_rules() called _M.filter() in several request phases. _M.filter() iterated through every loaded plugin and checked each one to determine whether it had been configured in the Global Rule:
-- Simplified illustration, not the complete APISIX implementation
for _, plugin_obj in ipairs(local_plugins) do
    local name = plugin_obj.name
    local plugin_conf = user_plugin_conf[name]
    if type(plugin_conf) ~= "table" then
        goto continue
    end
    -- Process configured plugins
    ::continue::
end
Two factors amplified the cost:
- The cost of each filtering pass increased with the number of loaded plugins.
- The same filtering result was regenerated across request phases. The
body_filteranddelayed_body_filterphases could also be entered multiple times for response-body chunks.
In this test configuration, one request triggered 9 filtering passes. The same request scanned more than 100 loaded plugins 9 times to find the same small set of configured plugins.
This explains why a Lua-level self time of 3.0% understated the cost of the entire path:
| Actual work | Common flame-graph attribution |
|---|---|
| The loop itself | Corresponding location in plugin.lua |
| Large numbers of table lookups | lj_BC_TGETS |
| Temporary table allocation | lj_alloc_malloc |
| Garbage collection of temporary objects | gc_sweep |
| Uncompiled interpreter dispatch | lj_vm_* / lj_BC_* |
At 3% self time, this path looked minor. Following the stack showed that it sat on a shared path entered repeatedly. The fix was to reuse the filtered plugin set within the same request whenever the Global Rule and matched route had not changed, rather than rebuild it in every phase.
4. When the Flame Graph Cannot Explain the Gap, Check LuaJIT
The second lead came from a custom observability component. Neither the component nor its logging bypass is part of APISIX OSS, but the failure mode matters to APISIX plugins and OpenResty extensions: a seemingly inexpensive call can add direct cost and change how subsequent caller code executes—through the interpreter or as machine code.
4.1 Interpreter Dispatch Was Abnormally Active
After reclassifying the C-level samples by runtime category, the clearest signal was how much time appeared under interpreter dispatch compared with observable JIT execution:
| Runtime category | CPU time per request | Share of samples |
|---|---|---|
Interpreter dispatch: lj_BC_* / lj_vm_* | 5.86 μs | 29.6% |
| Observable JIT trace execution | 2.55 μs | 12.9% |
JIT traces do not always unwind cleanly, so 12.9% is only a lower bound. Even so, interpreter dispatch remained high enough to suggest that some high-frequency paths might not be running consistently as machine code.
More traces would not necessarily be better. Initialization code does not need to be compiled, and trace costs vary widely. Compilation results are worth investigating only when the CPU is saturated, the path is hot, and interpreter dispatch is unusually active.
4.2 What jit.v Revealed—and Why We Misread It
With jit.v enabled, one short load test reported 417 successful trace compilations and 493 aborts. After aggregation by source location, a group of paths each stopped at exactly 11 aborts.
These are compilation-event counts—not unique functions, coverage, or CPU time. jit.v also has several important limitations:
- An abort line shows the trace abort location, while the penalty is applied to the trace starting point; the two may not be the same line.
- A function never appearing as a trace starting point does not mean it was never compiled. Its body may have been inlined into a parent trace.
- Text logs make it hard to reliably diff results between enabled and disabled runs.
At first, we read “0 appearances as a starting point” as “the whole function runs in the interpreter.” The bytecode mode of jit.dump proved otherwise: several function entries never became root traces, but their bodies repeatedly entered other traces. The recurring failures were in phase-entry and orchestration functions.
The absence of a trace starting point proves only that the location did not become a root-trace anchor. It does not prove that the entire function never entered machine code.
4.3 Correlate start, stop, and abort by Trace Start
To learn what failed to compile and why, we needed the event stream from LuaJIT itself. We stored each start location by trace ID, then mapped the matching stop or abort back to that same starting point:
-- Simplified illustration; actual callback arguments and parsing are more complex
local trace_start = {}

jit.attach(function(what, trace_id, func, pc, err_code)
    if what == "start" then
        trace_start[trace_id] = locate(func, pc)
    elseif what == "stop" then
        record_compiled(trace_start[trace_id])
        trace_start[trace_id] = nil
    elseif what == "abort" then
        record_abort(trace_start[trace_id], err_code)
        trace_start[trace_id] = nil
    end
end, "trace")
The real probe also needs jit.util.funcinfo to resolve source locations and jit.vmdef.traceerr to recover abort reasons. With that data, we can compare the component’s enabled and disabled states: which starting points compile, which repeatedly abort, and whether a trace flush occurs.
In the LuaJIT build used here, the failure penalty started at 72 and doubled after each failure. It was 36,864 on the 10th failure and reached 73,728 on the 11th, above the 60,000 limit. Several starting points stopped at exactly 11 aborts and never entered the compiled set. No trace flush occurred during collection, and the number of live traces in both test variants remained below the cache limit, ruling out trace-cache exhaustion. Together, the evidence showed that LuaJIT had abandoned further compilation attempts for those trace starts.
That still does not mean LuaJIT abandoned those functions entirely. Other parts could have been inlined into different traces.
When the data was grouped by caller, every affected phase-entry and orchestration function passed through the same custom logging bypass. Even when the log level was too low to emit output, this path still inspected the request phase, call stack, and request context. The added call did not appear as an obvious hotspot. Instead, it changed the JIT outcome of its callers, making part of the cost appear at function entry in ordinary request-processing functions.
-- Simplified custom extension, not an APISIX OSS implementation
if log_level_is_suppressed then
    check_debug_capture(...)
    check_request_buffer(...)
    return
end
The JIT data exposed costs the flame graph could not attribute cleanly and confirmed that toggling the feature changed how hot paths executed. It still could not quantify the throughput loss. The relevant fix was not to force every function to compile, but to skip the unnecessary work entirely when the feature was disabled.
Probe placement also mattered. A module can capture a function reference during require; replacing that function later leaves the captured reference untouched. Our late probe saw 1 call per request. Moving it before require("apisix") exposed the real rate: 5 calls per request.
5. Use Paired A/B Tests to Measure the Impact
The flame graph identified candidate locations, the call stacks showed why paths executed repeatedly, and the LuaJIT events explained why some CPU samples could not be attributed cleanly or were not visible in the flame graph. We still needed paired A/B tests to measure the throughput impact.
For the Global Rule path, we kept the same dispatch and configuration but made the Prometheus handler return immediately at function entry. This helped distinguish the cost of the plugin’s processing logic from that of the shared path before plugin entry. To avoid presenting absolute RPS from a customized environment as an APISIX OSS benchmark, we normalized throughput with Prometheus disabled to 100:
| Internal A/B scenario | Relative throughput index | Relative to Prometheus disabled |
|---|---|---|
| Prometheus disabled | 100.0 | Baseline |
| Plugin and dispatch retained; Prometheus handler returns at entry | 77.2 | -22.8% |
| Complete Prometheus Global Rule | 56.9 | -43.1% |
The gap remained even after short-circuiting the Prometheus processing code. The experiment did not identify a single expensive line, but it showed that metric calculation was not the only source of overhead. Together with the 9 filtering passes per request, the call stacks, and the C-level cost distribution, this result showed that repeated filtering and the shared pre-plugin path contributed materially to the throughput drop.
We used the same method for the custom observability component. With workload and configuration held constant, we collected compilation events, per-request call counts, throughput, and response correctness with the component on and off. JIT events explained why the feature did not appear as a single obvious hotspot in the flame graph; the end-to-end A/B test measured its effect on normalized throughput in this customized environment.
The investigation can be summarized in five steps:
| Step | Core question | Evidence |
|---|---|---|
| 1. Verify the worker is CPU-bound | Can the flame graph explain this regression? | Worker saturation, CPU pinning, upstream, network, and load-generator headroom, and stable reproduction |
| 2. Compare widths | Where do samples accumulate? | Global flame graph and candidate ranking |
| 3. Follow stacks | What multiplies a small local cost? | Request phases, shared functions, and per-request call counts |
| 4. Inspect LuaJIT | Why are some CPU samples misattributed or absent from the flame graph? | start, stop, abort, flush, and jit.dump |
| 5. Run paired A/B tests | How large is the effect, and is it causal? | Throughput, latency, call counts, error rate, and response consistency |
A few limits on what this shows:
- Flame-graph width, Lua self time, and throughput changes use different denominators and cannot be directly subtracted or divided.
- The custom observability component is not part of APISIX OSS. It is included only to illustrate a general issue that custom extensions may encounter.
- The values 29.6%, 12.9%, 417, 493, and abort ×11 apply only to this build and collection window and must not be extrapolated.
- “Did not become a trace starting point” does not mean “the function was not compiled.” You must check whether the function body entered other traces.
- JIT compilation results are diagnostic signals, not final performance metrics. Any optimization must still be validated against throughput, latency, error rate, response content, and GC behavior.
The flame graph was not wrong. Width showed where CPU samples accumulated, and call stacks showed how shared paths amplified the cost. But when that cost was attributed to interpreter symbols, JIT traces, the allocator, or caller functions, the graph no longer tied all of it back to the code that caused it.
When that happens, collect LuaJIT compilation events, count calls per request, and use paired A/B tests to measure the path’s effect on normalized throughput in the same environment rather than infer the cause from individual Lua lines. In this investigation, the evidence pointed to eliminating unnecessary repeated work rather than simply optimizing the widest flame-graph path.